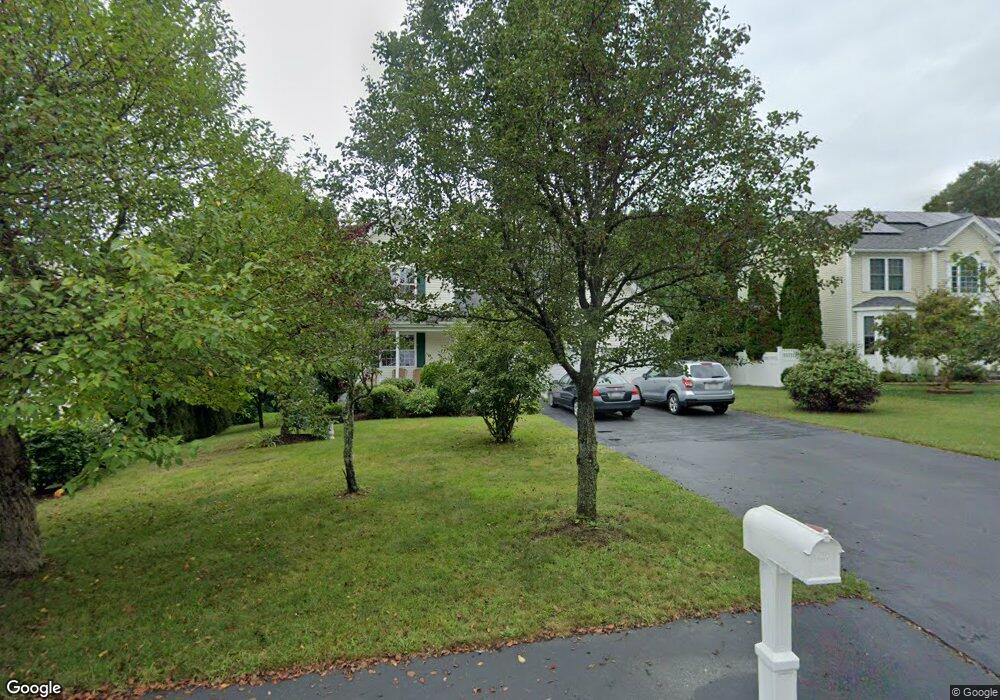
6 Belknap Cir Ashland, MA 01721
Estimated Value: $776,000 - $1,209,000
3
Beds
2
Baths
1,664
Sq Ft
$626/Sq Ft
Est. Value
About This Home
This home is located at 6 Belknap Cir, Ashland, MA 01721 and is currently estimated at $1,042,285, approximately $626 per square foot. 6 Belknap Cir is a home located in Middlesex County with nearby schools including William Pittaway Elementary School, David Mindess Elementary School, and Henry E. Warren Elementary School.
Ownership History
Date
Name
Owned For
Owner Type
Purchase Details
Closed on
Aug 18, 2016
Sold by
Reddy Rajeswari
Bought by
Reddy Rajeswari and Reddy Vemuri B
Current Estimated Value
Purchase Details
Closed on
Nov 20, 2003
Sold by
Silver-Ritter Amy and Ritter Jeffrey W
Bought by
Barnard Dani and Barnard Richard
Home Financials for this Owner
Home Financials are based on the most recent Mortgage that was taken out on this home.
Original Mortgage
$268,000
Interest Rate
5.98%
Mortgage Type
Purchase Money Mortgage
Create a Home Valuation Report for This Property
The Home Valuation Report is an in-depth analysis detailing your home's value as well as a comparison with similar homes in the area
Home Values in the Area
Average Home Value in this Area
Purchase History
| Date | Buyer | Sale Price | Title Company |
|---|---|---|---|
| Reddy Rajeswari | -- | -- | |
| Barnard Dani | $335,000 | -- |
Source: Public Records
Mortgage History
| Date | Status | Borrower | Loan Amount |
|---|---|---|---|
| Previous Owner | Barnard Dani | $268,000 |
Source: Public Records
Tax History
| Year | Tax Paid | Tax Assessment Tax Assessment Total Assessment is a certain percentage of the fair market value that is determined by local assessors to be the total taxable value of land and additions on the property. | Land | Improvement |
|---|---|---|---|---|
| 2025 | $12,156 | $951,900 | $271,300 | $680,600 |
| 2024 | $11,572 | $874,000 | $271,300 | $602,700 |
| 2023 | $10,460 | $759,600 | $258,800 | $500,800 |
| 2022 | $10,567 | $665,400 | $235,200 | $430,200 |
| 2021 | $10,093 | $633,600 | $235,200 | $398,400 |
| 2020 | $13,134 | $612,300 | $238,700 | $373,600 |
| 2019 | $11,308 | $590,200 | $238,700 | $351,500 |
| 2018 | $11,081 | $573,700 | $236,700 | $337,000 |
| 2017 | $9,269 | $555,000 | $236,700 | $318,300 |
| 2016 | $9,032 | $531,300 | $236,700 | $294,600 |
| 2015 | $8,901 | $514,500 | $223,500 | $291,000 |
| 2014 | $8,740 | $502,600 | $208,500 | $294,100 |
Source: Public Records
Map
Nearby Homes
- 0 Oak St
- 0 Oregon Rd
- 66 Cedar Hill Rd
- 10 Foothill Rd
- 98 Southville Rd Unit B
- 98 Southville Rd Unit 1
- 98 Southville Rd Unit 2
- 98 Southville Rd Unit A
- 203 Pleasant St
- 46 Pine Hill Rd
- 10 Lorenzo Dr
- 2 Braeburn Ln
- 9A Ashley Rd
- 20 Southville Rd
- 20 Braeburn Ln
- 0 Cross St
- 216 Boston Rd
- 30 Waterville Ln Unit 30
- 32 Waterville Ln Unit 32
- 34 Waterville Ln Unit 34
Your Personal Tour Guide
Ask me questions while you tour the home.