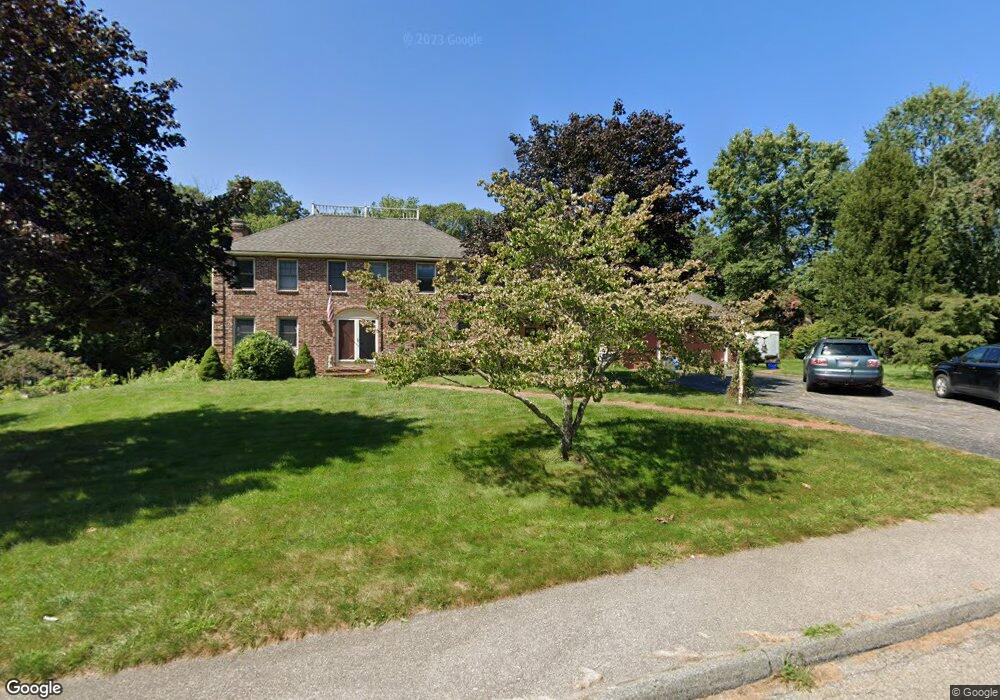
6 Bellstone Dr Bellingham, MA 02019
Estimated Value: $742,000 - $856,000
4
Beds
3
Baths
2,600
Sq Ft
$308/Sq Ft
Est. Value
About This Home
This home is located at 6 Bellstone Dr, Bellingham, MA 02019 and is currently estimated at $801,706, approximately $308 per square foot. 6 Bellstone Dr is a home located in Norfolk County with nearby schools including Joseph F. DiPietro Elementary, Bellingham High School, and Rise Prep Mayoral Academy Middle School.
Ownership History
Date
Name
Owned For
Owner Type
Purchase Details
Closed on
Aug 8, 1996
Sold by
Burns Heather E
Bought by
Ulsh Stuart and Ulsh Lynn
Current Estimated Value
Home Financials for this Owner
Home Financials are based on the most recent Mortgage that was taken out on this home.
Original Mortgage
$171,700
Interest Rate
8.24%
Mortgage Type
Purchase Money Mortgage
Purchase Details
Closed on
Dec 8, 1989
Sold by
Gagnon Roger N
Bought by
Burns Matthew J
Create a Home Valuation Report for This Property
The Home Valuation Report is an in-depth analysis detailing your home's value as well as a comparison with similar homes in the area
Home Values in the Area
Average Home Value in this Area
Purchase History
| Date | Buyer | Sale Price | Title Company |
|---|---|---|---|
| Ulsh Stuart | $216,500 | -- | |
| Ulsh Stuart | $216,500 | -- | |
| Burns Matthew J | $301,500 | -- | |
| Burns Matthew J | $301,500 | -- |
Source: Public Records
Mortgage History
| Date | Status | Borrower | Loan Amount |
|---|---|---|---|
| Open | Burns Matthew J | $170,000 | |
| Closed | Burns Matthew J | $171,700 |
Source: Public Records
Tax History Compared to Growth
Tax History
| Year | Tax Paid | Tax Assessment Tax Assessment Total Assessment is a certain percentage of the fair market value that is determined by local assessors to be the total taxable value of land and additions on the property. | Land | Improvement |
|---|---|---|---|---|
| 2025 | $8,335 | $663,600 | $181,100 | $482,500 |
| 2024 | $8,000 | $622,100 | $165,400 | $456,700 |
| 2023 | $7,709 | $590,700 | $157,500 | $433,200 |
| 2022 | $7,689 | $546,100 | $137,100 | $409,000 |
| 2021 | $7,417 | $514,700 | $137,100 | $377,600 |
| 2020 | $7,109 | $499,900 | $137,100 | $362,800 |
| 2019 | $6,966 | $490,200 | $137,100 | $353,100 |
| 2018 | $6,881 | $477,500 | $142,300 | $335,200 |
| 2017 | $6,680 | $465,800 | $142,300 | $323,500 |
| 2016 | $6,523 | $456,500 | $151,600 | $304,900 |
| 2015 | $6,260 | $439,300 | $145,800 | $293,500 |
| 2014 | $6,283 | $428,600 | $141,400 | $287,200 |
Source: Public Records
Map
Nearby Homes
- 361 S Main St
- 49R Elm St
- 70 Oswego St
- 41 Mansion St
- 4 Little Tree Ln
- 30 Oak St
- 540 Pulaski Blvd
- 20 Cooks Ln
- 60 Freeman St
- 90 Pleasant St
- 6 Fleuette Dr
- 66 Newland Ave
- 15 Fox Run Rd Unit 15
- 7 Elmwood St
- 21 Irving St
- Lot 1 Pickering Rd
- Lot 5 Pickering Rd
- Lot 2 Pickering Rd
- Lot 4 Pickering Rd
- Lot 3 Pickering Rd