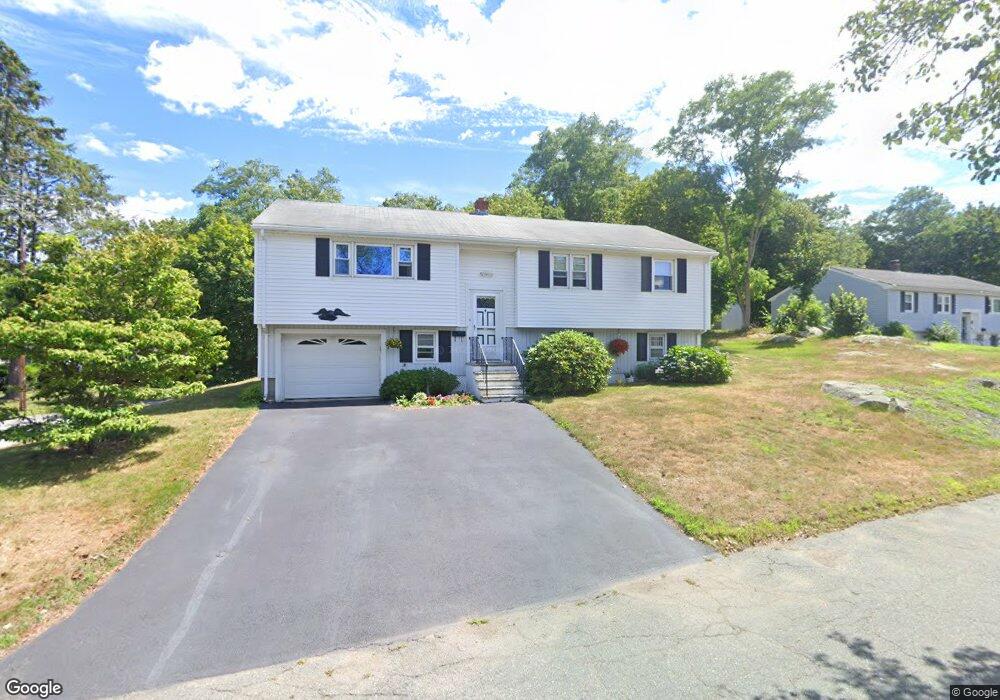
6 Blake St Beverly, MA 01915
North Beverly NeighborhoodEstimated Value: $683,743 - $785,000
3
Beds
2
Baths
1,290
Sq Ft
$570/Sq Ft
Est. Value
About This Home
This home is located at 6 Blake St, Beverly, MA 01915 and is currently estimated at $734,936, approximately $569 per square foot. 6 Blake St is a home located in Essex County with nearby schools including Beverly High School, The Saints Academy, and Shore Country Day School.
Ownership History
Date
Name
Owned For
Owner Type
Purchase Details
Closed on
Aug 17, 2016
Sold by
Dennis P Roy Ret and Roy
Bought by
Roy Dennis P
Current Estimated Value
Home Financials for this Owner
Home Financials are based on the most recent Mortgage that was taken out on this home.
Original Mortgage
$178,500
Outstanding Balance
$140,538
Interest Rate
3.41%
Mortgage Type
New Conventional
Estimated Equity
$594,398
Purchase Details
Closed on
Jun 20, 2016
Sold by
Roy Dennis P
Bought by
Dennis P Roy Ret and Roy
Home Financials for this Owner
Home Financials are based on the most recent Mortgage that was taken out on this home.
Original Mortgage
$178,500
Outstanding Balance
$140,538
Interest Rate
3.41%
Mortgage Type
New Conventional
Estimated Equity
$594,398
Purchase Details
Closed on
Jun 17, 2011
Sold by
Mokray Susan Marie
Bought by
Mokray Ft and Morkay
Purchase Details
Closed on
Jul 9, 2010
Sold by
Roy Arthur J Est and Roy
Bought by
Roy Dennis P and Mokray Susan Marie
Purchase Details
Closed on
Apr 5, 2007
Sold by
Roy Arthur J and Roy June P
Bought by
Roy Arthur J
Create a Home Valuation Report for This Property
The Home Valuation Report is an in-depth analysis detailing your home's value as well as a comparison with similar homes in the area
Home Values in the Area
Average Home Value in this Area
Purchase History
| Date | Buyer | Sale Price | Title Company |
|---|---|---|---|
| Roy Dennis P | -- | -- | |
| Dennis P Roy Ret | -- | -- | |
| Mokray Ft | -- | -- | |
| Roy Dennis P | -- | -- | |
| Roy Arthur J | -- | -- |
Source: Public Records
Mortgage History
| Date | Status | Borrower | Loan Amount |
|---|---|---|---|
| Open | Roy Dennis P | $178,500 |
Source: Public Records
Tax History
| Year | Tax Paid | Tax Assessment Tax Assessment Total Assessment is a certain percentage of the fair market value that is determined by local assessors to be the total taxable value of land and additions on the property. | Land | Improvement |
|---|---|---|---|---|
| 2025 | $6,625 | $602,800 | $374,800 | $228,000 |
| 2024 | $6,340 | $564,600 | $336,600 | $228,000 |
| 2023 | $6,098 | $541,600 | $313,600 | $228,000 |
| 2022 | $5,917 | $486,200 | $258,200 | $228,000 |
| 2021 | $5,439 | $428,300 | $227,600 | $200,700 |
| 2020 | $5,172 | $411,100 | $210,400 | $200,700 |
| 2019 | $5,055 | $382,700 | $195,100 | $187,600 |
| 2018 | $4,903 | $360,500 | $191,200 | $169,300 |
| 2017 | $4,587 | $321,200 | $149,200 | $172,000 |
| 2016 | $4,457 | $309,700 | $137,700 | $172,000 |
| 2015 | $4,370 | $309,700 | $137,700 | $172,000 |
Source: Public Records
Map
Nearby Homes
- 50 Balch St Unit 300
- 50 Balch St Unit 200
- 50 Balch St Unit 205
- 50 Balch St Unit 308
- 50 Balch St Unit 511
- 50 Balch St Unit 209
- 50 Balch St Unit 409
- 50 Balch St Unit 316
- 50 Balch St Unit 315
- 50 Balch St Unit 103
- 50 Balch St Unit 412
- 50 Balch St Unit 112
- 9 Swan St Unit 2
- 6 Charles St
- 348 Rantoul St Unit 202
- 34 Chase St
- 315 Rantoul St Unit 406
- 28 Arthur St Unit 3
- 261 Rantoul St
- 13 Giles Ave Unit 2
Your Personal Tour Guide
Ask me questions while you tour the home.