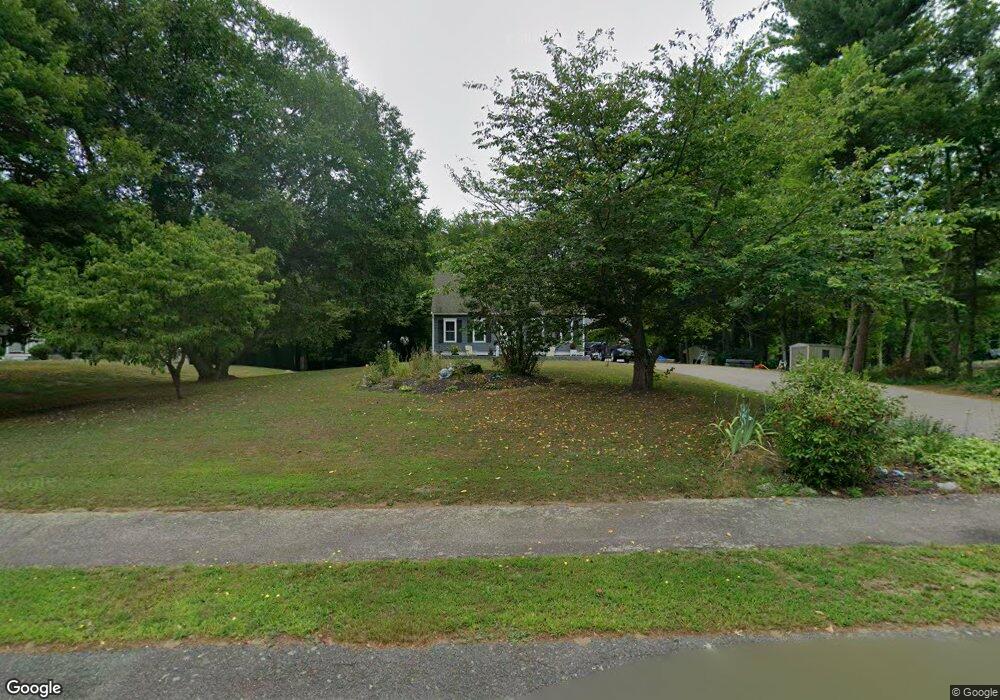
6 Blossom Ln Berkley, MA 02779
Estimated Value: $513,000 - $581,000
4
Beds
2
Baths
1,496
Sq Ft
$365/Sq Ft
Est. Value
About This Home
This home is located at 6 Blossom Ln, Berkley, MA 02779 and is currently estimated at $545,623, approximately $364 per square foot. 6 Blossom Ln is a home located in Bristol County with nearby schools including Berkley Community School.
Ownership History
Date
Name
Owned For
Owner Type
Purchase Details
Closed on
Mar 18, 2004
Sold by
Fernandes Joseph P and Fernandes Susan B
Bought by
Hines Jacqueline R and Hines Joseph L
Current Estimated Value
Home Financials for this Owner
Home Financials are based on the most recent Mortgage that was taken out on this home.
Original Mortgage
$275,000
Outstanding Balance
$126,909
Interest Rate
5.71%
Mortgage Type
Purchase Money Mortgage
Estimated Equity
$418,714
Purchase Details
Closed on
Mar 31, 1995
Sold by
Mdj Constr & Inv
Bought by
Fernandes Joseph P and Fernandes Susan B
Home Financials for this Owner
Home Financials are based on the most recent Mortgage that was taken out on this home.
Original Mortgage
$160,038
Interest Rate
8.8%
Mortgage Type
Purchase Money Mortgage
Create a Home Valuation Report for This Property
The Home Valuation Report is an in-depth analysis detailing your home's value as well as a comparison with similar homes in the area
Home Values in the Area
Average Home Value in this Area
Purchase History
| Date | Buyer | Sale Price | Title Company |
|---|---|---|---|
| Hines Jacqueline R | $332,000 | -- | |
| Fernandes Joseph P | $156,900 | -- | |
| Mdj Constr & Inv | $45,000 | -- |
Source: Public Records
Mortgage History
| Date | Status | Borrower | Loan Amount |
|---|---|---|---|
| Open | Hines Jacqueline R | $275,000 | |
| Previous Owner | Mdj Constr & Inv | $192,000 | |
| Previous Owner | Mdj Constr & Inv | $24,000 | |
| Previous Owner | Mdj Constr & Inv | $160,038 |
Source: Public Records
Tax History Compared to Growth
Tax History
| Year | Tax Paid | Tax Assessment Tax Assessment Total Assessment is a certain percentage of the fair market value that is determined by local assessors to be the total taxable value of land and additions on the property. | Land | Improvement |
|---|---|---|---|---|
| 2025 | $54 | $453,100 | $145,800 | $307,300 |
| 2024 | $5,240 | $420,900 | $125,600 | $295,300 |
| 2023 | $5,073 | $383,700 | $125,600 | $258,100 |
| 2022 | $4,928 | $358,400 | $109,200 | $249,200 |
| 2021 | $4,791 | $335,500 | $103,900 | $231,600 |
| 2020 | $4,692 | $322,900 | $92,000 | $230,900 |
| 2019 | $4,557 | $311,300 | $92,000 | $219,300 |
| 2018 | $4,174 | $297,700 | $88,500 | $209,200 |
| 2017 | $4,044 | $282,800 | $99,100 | $183,700 |
| 2016 | $3,913 | $263,700 | $99,100 | $164,600 |
| 2015 | $3,452 | $248,200 | $99,100 | $149,100 |
| 2014 | $3,315 | $258,800 | $107,600 | $151,200 |
Source: Public Records
Map
Nearby Homes
- 70 Plain St E
- 59 Seymour St
- 81 Tania Dr
- 2 Bc Ln
- 2 Lima Ln
- 220 Erin Rd
- 203 Bluejay Ln
- 50 Azalea Dr Unit 50
- 68 Metacomet Ave
- 3 Karena Dr Unit 8
- 28 B Staples St Unit B
- 52 Anthony St
- 29 Williams Ave
- 218R Hart St Unit B
- 170 Hart St Unit B
- 11 Talbot Ave
- 8 Herbert St
- 66 S Main St
- 147 Colonial Dr
- 195 Pratt St Unit A