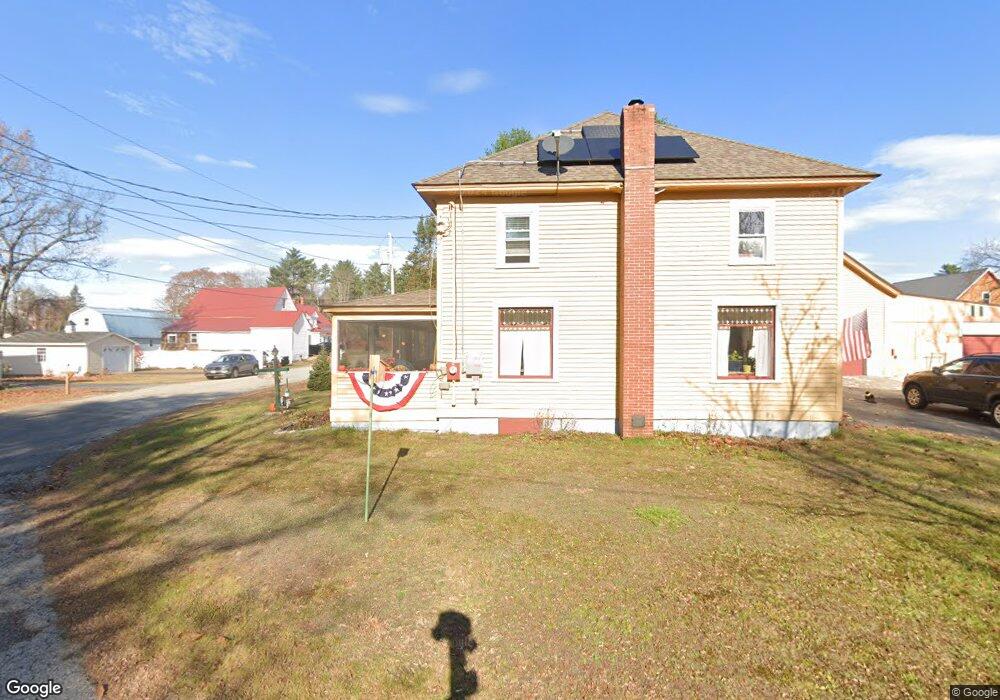
6 Bridge St N Cornish, ME 04020
Estimated Value: $345,113 - $382,000
3
Beds
2
Baths
1,820
Sq Ft
$195/Sq Ft
Est. Value
About This Home
This home is located at 6 Bridge St N, Cornish, ME 04020 and is currently estimated at $355,528, approximately $195 per square foot. 6 Bridge St N is a home located in York County.
Ownership History
Date
Name
Owned For
Owner Type
Purchase Details
Closed on
Jun 13, 2019
Sold by
Consalvi Roberta J
Bought by
Tripp Robert V
Current Estimated Value
Home Financials for this Owner
Home Financials are based on the most recent Mortgage that was taken out on this home.
Original Mortgage
$60,625
Outstanding Balance
$53,082
Interest Rate
4.1%
Mortgage Type
New Conventional
Estimated Equity
$302,446
Purchase Details
Closed on
Feb 5, 2007
Sold by
Baker Debra
Bought by
Consalvi Roberta J and Baker Debra A
Home Financials for this Owner
Home Financials are based on the most recent Mortgage that was taken out on this home.
Original Mortgage
$111,000
Interest Rate
6.16%
Mortgage Type
Unknown
Create a Home Valuation Report for This Property
The Home Valuation Report is an in-depth analysis detailing your home's value as well as a comparison with similar homes in the area
Home Values in the Area
Average Home Value in this Area
Purchase History
| Date | Buyer | Sale Price | Title Company |
|---|---|---|---|
| Tripp Robert V | -- | -- | |
| Consalvi Roberta J | -- | -- |
Source: Public Records
Mortgage History
| Date | Status | Borrower | Loan Amount |
|---|---|---|---|
| Open | Tripp Robert V | $60,625 | |
| Previous Owner | Consalvi Roberta J | $111,000 |
Source: Public Records
Tax History Compared to Growth
Tax History
| Year | Tax Paid | Tax Assessment Tax Assessment Total Assessment is a certain percentage of the fair market value that is determined by local assessors to be the total taxable value of land and additions on the property. | Land | Improvement |
|---|---|---|---|---|
| 2025 | $2,792 | $295,400 | $73,300 | $222,100 |
| 2024 | $2,730 | $296,700 | $46,700 | $250,000 |
| 2023 | $2,229 | $155,900 | $33,500 | $122,400 |
| 2022 | $2,151 | $155,900 | $33,500 | $122,400 |
| 2021 | $2,105 | $155,900 | $33,500 | $122,400 |
| 2020 | $2,089 | $155,900 | $33,500 | $122,400 |
| 2019 | $2,089 | $155,900 | $33,500 | $122,400 |
| 2018 | $2,105 | $155,900 | $33,500 | $122,400 |
| 2016 | $2,010 | $155,900 | $33,500 | $122,400 |
| 2015 | $2,011 | $155,900 | $33,500 | $122,400 |
| 2014 | $1,989 | $154,200 | $33,500 | $120,700 |
Source: Public Records
Map
Nearby Homes
- 4 Bridge St
- 20 Main St
- 22 High Rd
- 96 Maple St
- 696 S Hiram Rd
- 6-13 Main St
- Lot #3 Jordan Heights Rd
- Lot #2 Jordan Heights Rd
- Lot #8 Jordan Heights Rd
- Lot #4 Jordan Heights Rd
- Lot #11 Jordan Heights Rd
- 30 Waterfront Dr
- 992 Pequawket Trail
- 11 Marston Rd
- 266 S Hiram Rd
- Lot #5 Jordan Heights Rd
- 174 Marston Rd
- 1323 Cape Rd
- 20 Hollyhock Farm Ln
- 35 Pine St