Estimated Value: $576,072 - $701,000
4
Beds
5
Baths
4,440
Sq Ft
$143/Sq Ft
Est. Value
About This Home
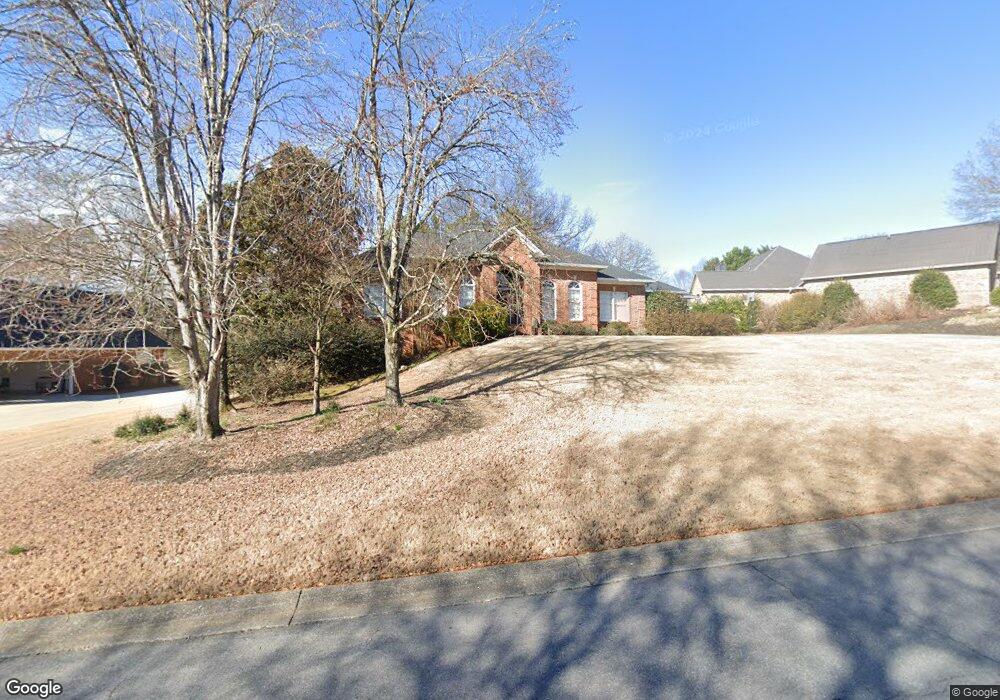
This home is located at 6 Bridgeview Dr SE, Rome, GA 30161 and is currently estimated at $634,357, approximately $142 per square foot. 6 Bridgeview Dr SE is a home located in Floyd County with nearby schools including Model Middle School, Model High School, and Unity Christian School.
Ownership History
Date
Name
Owned For
Owner Type
Purchase Details
Closed on
Sep 7, 2016
Sold by
Griffiths Charlotte D
Bought by
Bragg Jim R and Bragg Victoria S
Current Estimated Value
Home Financials for this Owner
Home Financials are based on the most recent Mortgage that was taken out on this home.
Original Mortgage
$307,920
Outstanding Balance
$243,435
Interest Rate
3.45%
Mortgage Type
New Conventional
Estimated Equity
$390,922
Purchase Details
Closed on
Aug 5, 2010
Sold by
Griffiths Mark
Bought by
Griffiths Charlotte D
Purchase Details
Closed on
Nov 25, 1998
Sold by
Griffiths Mark
Bought by
Griffiths Mark A and Grif Charlotte D
Purchase Details
Closed on
Feb 20, 1998
Sold by
Hansard Larry
Bought by
Griffiths Mark
Purchase Details
Closed on
Aug 3, 1994
Sold by
Larry Alexander H and Larry Hansard
Bought by
Hansard Larry
Purchase Details
Closed on
Oct 28, 1988
Bought by
P and R
Create a Home Valuation Report for This Property
The Home Valuation Report is an in-depth analysis detailing your home's value as well as a comparison with similar homes in the area
Home Values in the Area
Average Home Value in this Area
Purchase History
| Date | Buyer | Sale Price | Title Company |
|---|---|---|---|
| Bragg Jim R | $384,900 | -- | |
| Griffiths Charlotte D | -- | -- | |
| Griffiths Mark A | -- | -- | |
| Griffiths Mark | $42,700 | -- | |
| Hansard Larry | $127,500 | -- | |
| P | -- | -- | |
| Larry Alexander H | -- | -- |
Source: Public Records
Mortgage History
| Date | Status | Borrower | Loan Amount |
|---|---|---|---|
| Open | Bragg Jim R | $307,920 |
Source: Public Records
Tax History
| Year | Tax Paid | Tax Assessment Tax Assessment Total Assessment is a certain percentage of the fair market value that is determined by local assessors to be the total taxable value of land and additions on the property. | Land | Improvement |
|---|---|---|---|---|
| 2025 | $5,606 | $263,299 | $19,589 | $243,710 |
| 2024 | $5,606 | $246,793 | $18,480 | $228,313 |
| 2023 | $5,612 | $240,269 | $18,480 | $221,789 |
| 2022 | $5,066 | $204,606 | $17,600 | $187,006 |
| 2021 | $4,843 | $187,810 | $17,600 | $170,210 |
| 2020 | $3,658 | $174,322 | $17,600 | $156,722 |
| 2019 | $4,169 | $166,746 | $17,600 | $149,146 |
| 2018 | $4,031 | $158,963 | $17,600 | $141,363 |
| 2017 | $3,923 | $152,539 | $17,600 | $134,939 |
| 2016 | $3,747 | $140,491 | $17,600 | $122,891 |
| 2015 | $3,697 | $140,491 | $17,600 | $122,891 |
| 2014 | $3,697 | $140,491 | $17,600 | $122,891 |
Source: Public Records
Map
Nearby Homes
- 4 Bridgeview Dr SE
- 30 Covey Rise Dr SE
- 94 Tate Estates Rd SE
- 4 Covey Rise Dr SE
- 12 Covey Rise Dr SE
- 8 Covey Rise Dr SE
- 20 Covey Rise Dr SE
- 11 Breckenridge Rd SE
- 4 Coach Trail SE
- 4 Windemere Ln SE
- 0 Heather Rd SE Unit 10709953
- 22 Oakfield Dr SE
- 2 Maplewood Square SE
- 627 Freeman Ferry Rd SE
- 0 Mountain View Rd SE Unit 29
- 0 Mountain View Rd SE Unit 7709912
- 14 Mitchell Cir SE
- 20 Mitchell Cir SE
- 452 Mountain View Rd SE
- 71 Freeman Ferry Rd SE
- 8 Bridgeview Dr SE
- 103 Etowah Dr SE Unit 27
- 103 Etowah Dr SE
- 9 Bridgeview Dr SE
- 105 Etowah Dr SE
- 11 Bridgeview Dr SE
- 10 Bridgeview Dr SE
- 101 Etowah Dr SE
- 7 Bridgeview Dr SE
- 107 Etowah Dr SE
- 5 Bridgeview Dr SE Unit 55
- 5 Bridgeview Dr SE
- 3 Bridgeview Dr SE
- 12 Bridgeview Dr SE
- 1 Bridgeview Dr SE
- 15 Bridgeview Dr SE
- 109 Etowah Dr SE
- 104 Etowah Dr SE
- 102 Etowah Dr SE
- 106 Etowah Dr SE
Your Personal Tour Guide
Ask me questions while you tour the home.