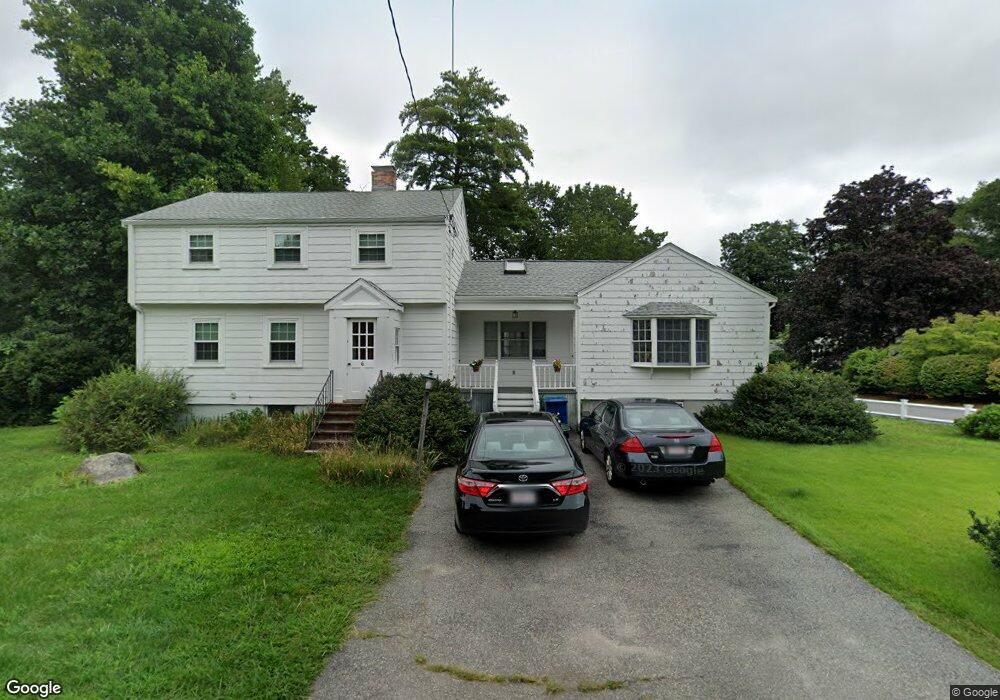
6 Bruce St Burlington, MA 01803
North Burlington NeighborhoodEstimated Value: $868,000 - $1,037,000
4
Beds
3
Baths
2,569
Sq Ft
$365/Sq Ft
Est. Value
About This Home
This home is located at 6 Bruce St, Burlington, MA 01803 and is currently estimated at $937,557, approximately $364 per square foot. 6 Bruce St is a home located in Middlesex County with nearby schools including Burlington High School, Pine Glen Elementary School, and Marshall Simonds Middle School.
Ownership History
Date
Name
Owned For
Owner Type
Purchase Details
Closed on
May 27, 2025
Sold by
Fazio Michael J and Presti-Fazio Frances J
Bought by
Frances J Presti-Fazio Lt and Fazio
Current Estimated Value
Purchase Details
Closed on
Oct 16, 1987
Sold by
Horman Edward F
Bought by
Fazio Michael J
Home Financials for this Owner
Home Financials are based on the most recent Mortgage that was taken out on this home.
Original Mortgage
$153,100
Interest Rate
10.63%
Mortgage Type
Purchase Money Mortgage
Create a Home Valuation Report for This Property
The Home Valuation Report is an in-depth analysis detailing your home's value as well as a comparison with similar homes in the area
Home Values in the Area
Average Home Value in this Area
Purchase History
| Date | Buyer | Sale Price | Title Company |
|---|---|---|---|
| Frances J Presti-Fazio Lt | -- | None Available | |
| Frances J Presti-Fazio Lt | -- | None Available | |
| Fazio Michael J | $175,500 | -- |
Source: Public Records
Mortgage History
| Date | Status | Borrower | Loan Amount |
|---|---|---|---|
| Previous Owner | Fazio Michael J | $153,100 |
Source: Public Records
Tax History
| Year | Tax Paid | Tax Assessment Tax Assessment Total Assessment is a certain percentage of the fair market value that is determined by local assessors to be the total taxable value of land and additions on the property. | Land | Improvement |
|---|---|---|---|---|
| 2025 | $6,951 | $802,600 | $425,000 | $377,600 |
| 2024 | $6,770 | $757,300 | $403,000 | $354,300 |
| 2023 | $6,557 | $697,600 | $350,000 | $347,600 |
| 2022 | $6,383 | $641,500 | $319,000 | $322,500 |
| 2021 | $6,094 | $612,500 | $290,000 | $322,500 |
| 2020 | $5,853 | $607,200 | $290,000 | $317,200 |
| 2019 | $5,738 | $547,500 | $271,000 | $276,500 |
| 2018 | $5,589 | $526,300 | $258,000 | $268,300 |
| 2017 | $5,406 | $526,300 | $258,000 | $268,300 |
| 2016 | $5,367 | $468,300 | $220,000 | $248,300 |
| 2015 | $5,315 | $468,300 | $220,000 | $248,300 |
| 2014 | $5,178 | $431,500 | $200,000 | $231,500 |
Source: Public Records
Map
Nearby Homes
- 20 Alma Rd
- 23 Wilmington Rd
- 23 County Rd
- 345 Cambridge St
- 0 Bedford St
- 2 Stephanie St
- 13 Wing Terrace
- 10 Moss St
- 1 Joanne Rd
- 41 Glenvale Ave
- 14 Sarah St
- 29 Beaverbrook Rd
- 17 Glenvale Ave
- 11 Caroline St
- 23 Rocky Hill Rd
- 12 Murray Ave Unit 18
- 12 Ridgeway Ave
- 27 Purity Springs Rd
- 42 Wildcrest Ave
- 5 Cook Rd
Your Personal Tour Guide
Ask me questions while you tour the home.