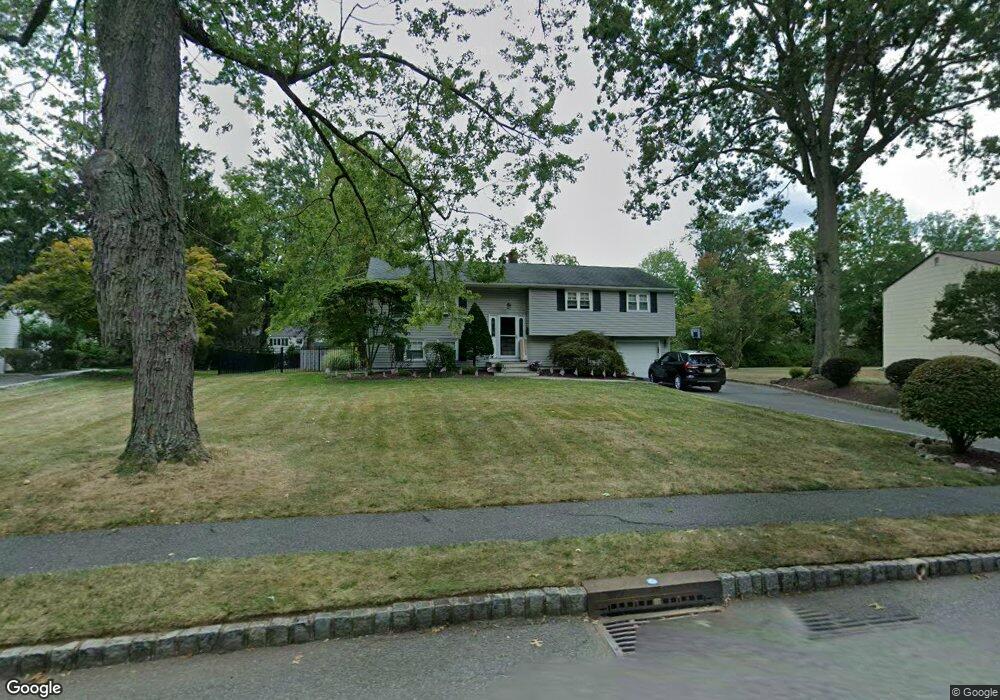
6 Bunyan Dr Livingston, NJ 07039
Estimated Value: $1,126,000 - $1,235,988
--
Bed
--
Bath
--
Sq Ft
0.35
Acres
About This Home
This home is located at 6 Bunyan Dr, Livingston, NJ 07039 and is currently estimated at $1,180,997. 6 Bunyan Dr is a home located in Essex County with nearby schools including Livingston Sr High School and Aquinas Academy.
Ownership History
Date
Name
Owned For
Owner Type
Purchase Details
Closed on
Dec 14, 2005
Sold by
Mobility Cendant
Bought by
Napolitano James and Napolitano Joanne
Current Estimated Value
Home Financials for this Owner
Home Financials are based on the most recent Mortgage that was taken out on this home.
Original Mortgage
$477,000
Interest Rate
6.31%
Purchase Details
Closed on
Sep 20, 2005
Sold by
Catherwood Scott
Bought by
Mobility Cendant
Home Financials for this Owner
Home Financials are based on the most recent Mortgage that was taken out on this home.
Original Mortgage
$477,000
Interest Rate
5.87%
Mortgage Type
Adjustable Rate Mortgage/ARM
Purchase Details
Closed on
Jun 13, 2003
Sold by
Whitley George
Bought by
Catherwood Scott and Catherwood Tammy
Home Financials for this Owner
Home Financials are based on the most recent Mortgage that was taken out on this home.
Original Mortgage
$246,000
Interest Rate
5.53%
Create a Home Valuation Report for This Property
The Home Valuation Report is an in-depth analysis detailing your home's value as well as a comparison with similar homes in the area
Home Values in the Area
Average Home Value in this Area
Purchase History
| Date | Buyer | Sale Price | Title Company |
|---|---|---|---|
| Napolitano James | $650,000 | -- | |
| Mobility Cendant | $650,000 | -- | |
| Catherwood Scott | $307,500 | -- |
Source: Public Records
Mortgage History
| Date | Status | Borrower | Loan Amount |
|---|---|---|---|
| Previous Owner | Napolitano James | $477,000 | |
| Previous Owner | Mobility Cendant | $477,000 | |
| Previous Owner | Catherwood Scott | $246,000 |
Source: Public Records
Tax History Compared to Growth
Tax History
| Year | Tax Paid | Tax Assessment Tax Assessment Total Assessment is a certain percentage of the fair market value that is determined by local assessors to be the total taxable value of land and additions on the property. | Land | Improvement |
|---|---|---|---|---|
| 2025 | $14,899 | $628,100 | $388,700 | $239,400 |
| 2024 | $14,899 | $628,100 | $388,700 | $239,400 |
| 2022 | $14,654 | $628,100 | $388,700 | $239,400 |
| 2021 | $14,534 | $628,100 | $388,700 | $239,400 |
| 2020 | $14,264 | $628,100 | $388,700 | $239,400 |
| 2019 | $14,548 | $556,100 | $353,700 | $202,400 |
| 2018 | $14,353 | $556,100 | $353,700 | $202,400 |
| 2017 | $14,164 | $556,100 | $353,700 | $202,400 |
| 2016 | $13,903 | $556,100 | $353,700 | $202,400 |
| 2015 | $13,697 | $556,100 | $353,700 | $202,400 |
| 2014 | $13,252 | $556,100 | $353,700 | $202,400 |
Source: Public Records
Map
Nearby Homes