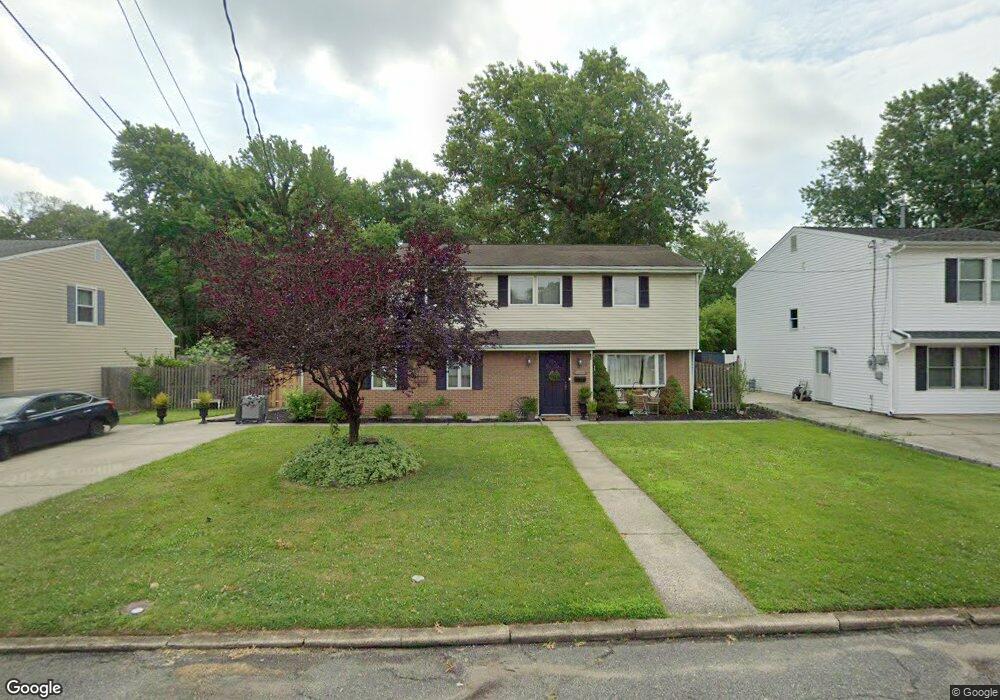
6 Carriage Rd N Hazlet, NJ 07730
Estimated Value: $554,000 - $620,000
3
Beds
2
Baths
1,936
Sq Ft
$308/Sq Ft
Est. Value
About This Home
This home is located at 6 Carriage Rd N, Hazlet, NJ 07730 and is currently estimated at $597,235, approximately $308 per square foot. 6 Carriage Rd N is a home located in Monmouth County with nearby schools including Raritan High School, Icob Academy, and St. Joseph Elementary School.
Ownership History
Date
Name
Owned For
Owner Type
Purchase Details
Closed on
Dec 24, 2008
Sold by
Dressler Mary
Bought by
Dressler Mary
Current Estimated Value
Home Financials for this Owner
Home Financials are based on the most recent Mortgage that was taken out on this home.
Original Mortgage
$237,000
Outstanding Balance
$151,856
Interest Rate
5.52%
Mortgage Type
New Conventional
Estimated Equity
$445,379
Purchase Details
Closed on
Jan 8, 2004
Sold by
Dressler John
Bought by
Pagetta Ettore
Home Financials for this Owner
Home Financials are based on the most recent Mortgage that was taken out on this home.
Original Mortgage
$225,000
Interest Rate
5.62%
Purchase Details
Closed on
Nov 30, 1994
Sold by
Gibbons Michael
Bought by
Dressler John and Dressler Mary
Home Financials for this Owner
Home Financials are based on the most recent Mortgage that was taken out on this home.
Original Mortgage
$148,000
Interest Rate
9.03%
Create a Home Valuation Report for This Property
The Home Valuation Report is an in-depth analysis detailing your home's value as well as a comparison with similar homes in the area
Home Values in the Area
Average Home Value in this Area
Purchase History
| Date | Buyer | Sale Price | Title Company |
|---|---|---|---|
| Dressler Mary | -- | Regional Title Agency Llc | |
| Pagetta Ettore | $300,000 | -- | |
| Dressler John | $156,000 | -- |
Source: Public Records
Mortgage History
| Date | Status | Borrower | Loan Amount |
|---|---|---|---|
| Open | Dressler Mary | $237,000 | |
| Previous Owner | Pagetta Ettore | $225,000 | |
| Previous Owner | Dressler John | $148,000 |
Source: Public Records
Tax History Compared to Growth
Tax History
| Year | Tax Paid | Tax Assessment Tax Assessment Total Assessment is a certain percentage of the fair market value that is determined by local assessors to be the total taxable value of land and additions on the property. | Land | Improvement |
|---|---|---|---|---|
| 2025 | $10,193 | $537,500 | $350,800 | $186,700 |
| 2024 | $9,939 | $484,700 | $298,800 | $185,900 |
| 2023 | $9,939 | $465,100 | $280,800 | $184,300 |
| 2022 | $9,211 | $396,100 | $233,800 | $162,300 |
| 2021 | $9,060 | $359,100 | $214,800 | $144,300 |
| 2020 | $9,060 | $350,900 | $209,800 | $141,100 |
| 2019 | $8,700 | $331,700 | $194,800 | $136,900 |
| 2018 | $8,472 | $320,300 | $189,800 | $130,500 |
| 2017 | $7,906 | $298,900 | $175,800 | $123,100 |
| 2016 | $7,794 | $295,800 | $175,800 | $120,000 |
| 2015 | $7,860 | $299,100 | $170,800 | $128,300 |
| 2014 | $7,207 | $257,200 | $134,800 | $122,400 |
Source: Public Records
Map
Nearby Homes
- 788 Poole Ave
- 3 Julia Ln
- 11 Lammers St
- 2108 Florence Ave
- 74 Fieldcrest Way
- 59 Ron Rd
- 1 Panagias Astadiotissis Agios Theodoros
- 8 Lynn Blvd
- 52 Monique Cir
- 13 Irwin Place
- 4 Lafayette Dr
- 17 Green Tree Cir
- 25-27 Brook Ave
- 3 Duke Ln
- 231 Atlantic St Unit 23
- 1213 New Jersey 36
- 26 Nevada Dr
- 74 Manchester Ave
- 72 Manchester Ave
- 195 Atlantic St
- 4 Carriage Rd N
- 8 Carriage Rd N
- 201 Middle Rd
- 2 Carriage Rd N
- 10 Carriage Rd N
- 5 Carriage Rd N
- 3 Carriage Rd N
- 1 Carriage Rd N
- 16 E Coach Dr
- 12 Carriage Rd N
- 11 Carriage Rd N
- 193 Middle Rd
- 14 E Coach Dr
- 1 Carriage Rd
- 15 E Coach Dr
- 14 Carriage Rd N
- 2 Carriage Rd
- 191 Middle Rd
- 196 Middle Rd
- 13 E Coach Dr