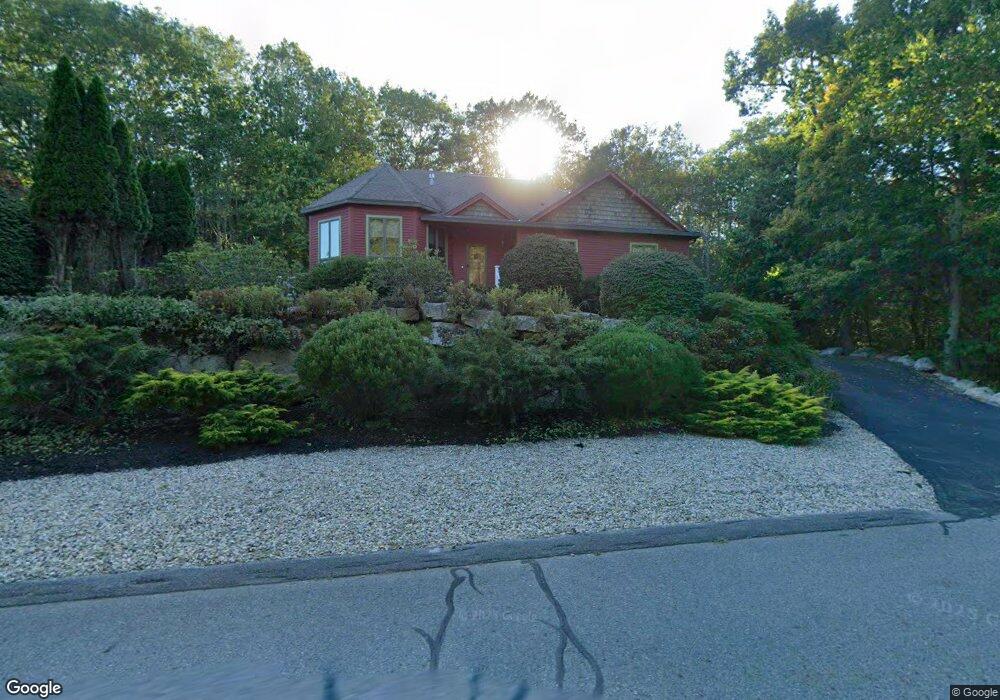
6 Castle View Dr Gloucester, MA 01930
West Gloucester NeighborhoodEstimated Value: $1,316,864 - $1,629,000
3
Beds
2
Baths
1,938
Sq Ft
$773/Sq Ft
Est. Value
About This Home
This home is located at 6 Castle View Dr, Gloucester, MA 01930 and is currently estimated at $1,497,716, approximately $772 per square foot. 6 Castle View Dr is a home located in Essex County with nearby schools including West Parish, Ralph B O'maley Middle School, and Gloucester High School.
Ownership History
Date
Name
Owned For
Owner Type
Purchase Details
Closed on
Aug 22, 2014
Sold by
Luster Martin A and Luster Barbara
Bought by
Barbara Luster Ret and Luster Barbara
Current Estimated Value
Purchase Details
Closed on
Jan 8, 2010
Sold by
Ricci James A
Bought by
Luster Martin A
Purchase Details
Closed on
Oct 3, 2005
Sold by
Buckman-Franks Janice G and Franks Robert P
Bought by
Ricci James A
Create a Home Valuation Report for This Property
The Home Valuation Report is an in-depth analysis detailing your home's value as well as a comparison with similar homes in the area
Home Values in the Area
Average Home Value in this Area
Purchase History
| Date | Buyer | Sale Price | Title Company |
|---|---|---|---|
| Barbara Luster Ret | -- | -- | |
| Luster Martin A | $625,000 | -- | |
| Ricci James A | $700,000 | -- |
Source: Public Records
Mortgage History
| Date | Status | Borrower | Loan Amount |
|---|---|---|---|
| Previous Owner | Ricci James A | $50,000 | |
| Previous Owner | Ricci James A | $382,000 |
Source: Public Records
Tax History
| Year | Tax Paid | Tax Assessment Tax Assessment Total Assessment is a certain percentage of the fair market value that is determined by local assessors to be the total taxable value of land and additions on the property. | Land | Improvement |
|---|---|---|---|---|
| 2025 | $10,109 | $1,040,000 | $316,600 | $723,400 |
| 2024 | $9,863 | $1,013,700 | $301,600 | $712,100 |
| 2023 | $10,103 | $954,000 | $269,100 | $684,900 |
| 2022 | $9,470 | $807,300 | $228,900 | $578,400 |
| 2021 | $9,571 | $769,400 | $208,300 | $561,100 |
| 2020 | $9,065 | $735,200 | $208,300 | $526,900 |
| 2019 | $9,104 | $717,400 | $208,300 | $509,100 |
| 2018 | $9,255 | $715,800 | $208,300 | $507,500 |
| 2017 | $10,424 | $790,300 | $305,100 | $485,200 |
| 2016 | $9,806 | $720,500 | $291,800 | $428,700 |
| 2015 | $9,559 | $700,300 | $285,100 | $415,200 |
Source: Public Records
Map
Nearby Homes
- 167 Atlantic St
- 226 Atlantic St
- 13 Honeysuckle Rd
- 672 Washington St
- 2 Finch Ln
- 7 Leaman Dr
- 5 Samoset Rd Unit B
- 368 Essex Ave
- 357 Concord St
- 5 Lepage Ln
- 7 Colburn St
- 6 Monroe Ct
- 98 Maplewood Ave
- 587 Essex Ave
- 15 Harvard St
- 84 Centennial Ave
- 40 Sargent St
- 20 Beacon St Unit 2
- 20 Beacon St Unit 1
- 33 Maplewood Ave Unit 16
- 6 Castle View Dr
- 5 Schooner Ridge
- 9 Castle View Dr
- 14 Castle View Dr
- 3 Schooner Ridge
- 3 Castle View Dr
- 1 Castle View Dr
- 1 Sea Fox Ln
- 4 Schooner Ridge
- 6 Schooner Ridge
- 8 Castleview Drive- Lot 8
- 8 Castle View Dr
- 5A Castle View Dr
- 8A Castle View Dr
- 10 Castle View Dr
- 9 Schooner Ridge
- 4A Castle View Dr
- 8 Schooner Ridge
- 2 Schooner Ridge
- 2 Sea Fox Ln
Your Personal Tour Guide
Ask me questions while you tour the home.