6 Chaparral Ct La Junta, CO 81050
Estimated Value: $322,404 - $391,000
About This Home
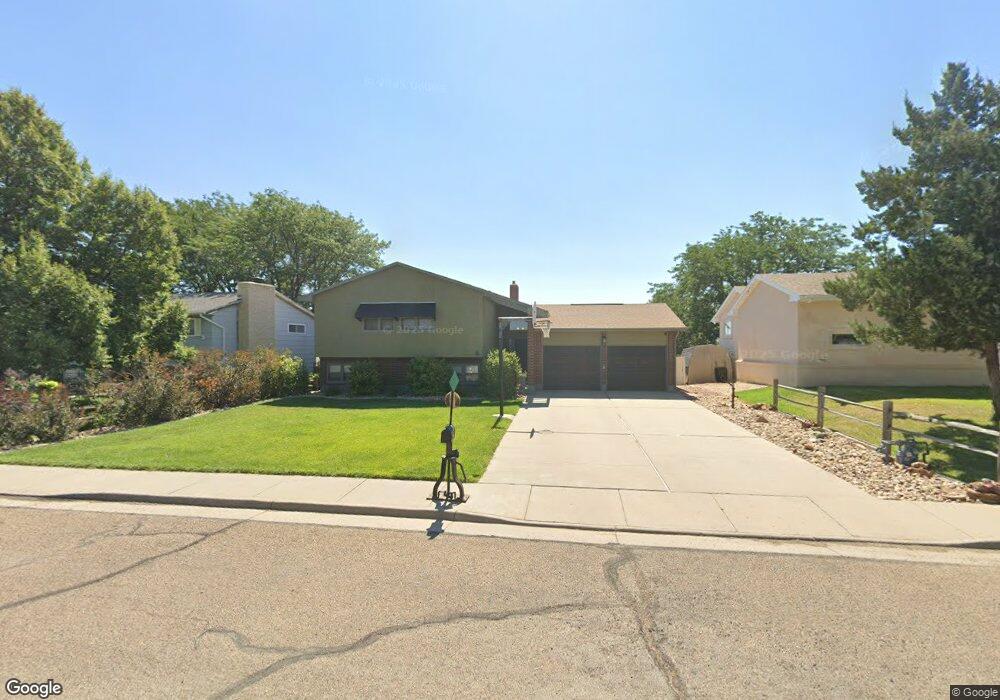
This home is located at 6 Chaparral Ct, La Junta, CO 81050 and is currently estimated at $350,851, approximately $289 per square foot. 6 Chaparral Ct is a home located in Otero County with nearby schools including La Junta Intermediate School, La Junta Primary School, and La Junta Junior/Senior High School.
Ownership History
We collect this data history from publicly available records. To have your information removed, we recommend requesting removal directly through your county’s website.
Purchase Details
Purchase Details
Purchase Details
Home Financials for this Owner
Home Financials are based on the most recent Mortgage that was taken out on this home.Purchase Details
Home Financials for this Owner
Home Financials are based on the most recent Mortgage that was taken out on this home.Home Values in the Area
Average Home Value in this Area
Purchase History
We collect this data history from publicly available records. To have your information removed, we recommend requesting removal directly through your county’s website.
| Date | Buyer | Sale Price | Title Company |
|---|---|---|---|
| $252,000 | Nationllink | ||
| -- | None Available | ||
| $151,500 | None Available | ||
| $155,000 | None Available |
Mortgage History
We collect this data history from publicly available records. To have your information removed, we recommend requesting removal directly through your county’s website.
| Date | Status | Borrower | Loan Amount |
|---|---|---|---|
| Previous Owner | $146,197 | ||
| Previous Owner | $155,000 |
Tax History
We collect this data history from publicly available records. To have your information removed, we recommend requesting removal directly through your county’s website.
| Year | Tax Paid | Tax Assessment Tax Assessment Total Assessment is a certain percentage of the fair market value that is determined by local assessors to be the total taxable value of land and additions on the property. | Land | Improvement |
|---|---|---|---|---|
| 2025 | $1,126 | $16,009 | $0 | $0 |
| 2024 | $894 | $13,570 | $804 | $12,766 |
| 2023 | $894 | $13,570 | $804 | $12,766 |
| 2022 | $976 | $14,465 | $834 | $13,631 |
| 2021 | $966 | $14,882 | $858 | $14,024 |
| 2020 | $795 | $12,384 | $858 | $11,526 |
| 2019 | $805 | $12,384 | $858 | $11,526 |
| 2018 | $728 | $11,232 | $864 | $10,368 |
| 2017 | $724 | $11,232 | $864 | $10,368 |
| 2016 | $803 | $11,619 | $955 | $10,664 |
| 2015 | $868 | $11,619 | $955 | $10,664 |
| 2014 | $868 | $11,103 | $955 | $10,148 |
Map
- 18 Chaparral Cir
- 102 W 26th St
- 14 Chaparral Cir
- 10 Chaparral Ct
- 56 Sierra Dr
- 15 Circle Dr
- 77 Circle Dr
- 2107
- 2107 Carson Ave
- 2001 Raton Ave
- 1801 Raton Ave
- 1812 Smithland Ave
- 1720 Colorado Ave
- 1722 Lincoln Ave
- 1504 Belleview Ave
- 0 Yucca Rd
- 1322 Lincoln Ave
- 1310 Carson Ave
- 1218 Smithland Ave
- 1518 Bradish Ave
- 17 Chaparral Cir
- 15 Chaparral Cir
- 11 Chaparral Ct
- 9 Chaparral Ct
- 5 Chaparral Ct
- 1 Chaparral Ct
- 13 Chaparral Cir
- 16 Chaparral Cir
- 4 Chaparral Cir
- 6 Chaparral Ct
- 108 W 26th St
- 11 Chaparral Cir
- 14 Chaparral Cir Unit 14
- 0 Chaparral Cir Unit 14
- 0 Chaparral Cir Unit 28.5
- 12 Chaparral Cir
- 20 Chaparral Cir
- 110 W 26th St
- 7 Chaparral Cir
- 22 Chaparral Cir
Ask me questions while you tour the home.