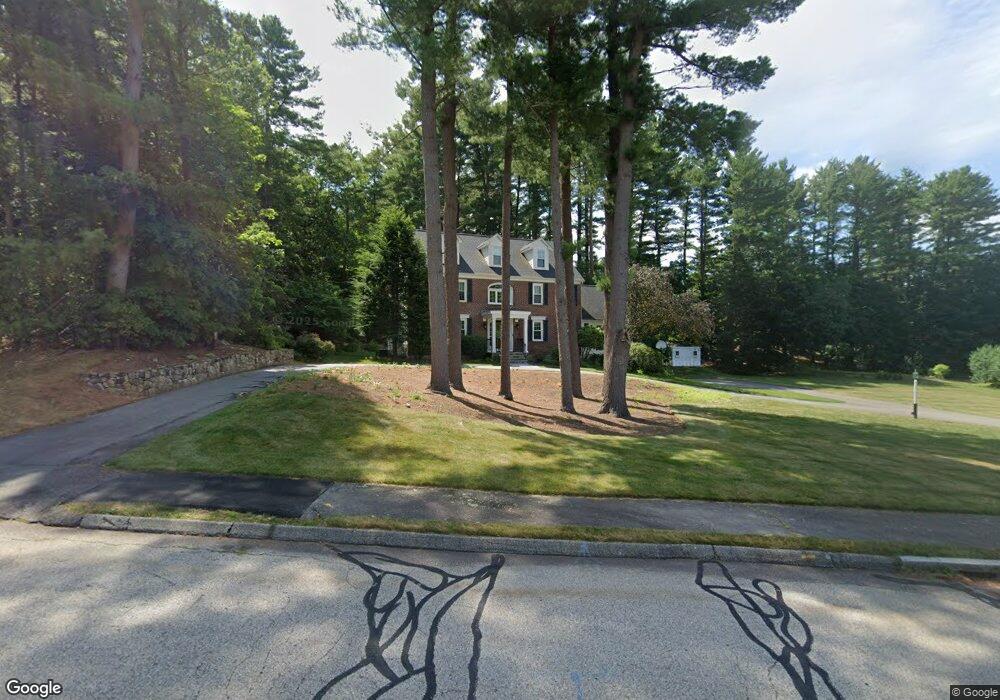
6 Cherry Tree Ln Foxboro, MA 02035
Estimated Value: $1,076,000 - $1,387,000
4
Beds
4
Baths
3,078
Sq Ft
$393/Sq Ft
Est. Value
About This Home
This home is located at 6 Cherry Tree Ln, Foxboro, MA 02035 and is currently estimated at $1,210,017, approximately $393 per square foot. 6 Cherry Tree Ln is a home located in Norfolk County with nearby schools including Foxborough High School, Foxborough Regional Charter School, and The Sage School.
Ownership History
Date
Name
Owned For
Owner Type
Purchase Details
Closed on
Dec 28, 2007
Sold by
Steward Christopher
Bought by
Poku Osei T and Poku Sheila Aa
Current Estimated Value
Purchase Details
Closed on
May 20, 2004
Sold by
Steward Christopher
Bought by
Poku Osei T and Poku Sheila A A
Home Financials for this Owner
Home Financials are based on the most recent Mortgage that was taken out on this home.
Original Mortgage
$500,000
Interest Rate
5.75%
Mortgage Type
Purchase Money Mortgage
Purchase Details
Closed on
Jul 1, 1998
Sold by
Birkmire Rex A and Birkmire Ann T
Bought by
Steward Christopher
Purchase Details
Closed on
Aug 15, 1996
Sold by
Young James F and Young Diana M
Bought by
Birkmire Rex A and Birkmire Ann T
Purchase Details
Closed on
Aug 11, 1993
Sold by
Luscher John E and Luscher Judith A
Bought by
Young James F and Young Diana M
Purchase Details
Closed on
Mar 23, 1992
Sold by
Eastern Mass Homes Inc
Bought by
Luscher John E and Luscher Judith A
Purchase Details
Closed on
Sep 20, 1991
Sold by
Washington Crsng Rt
Bought by
Eastern Mass Homes Inc
Create a Home Valuation Report for This Property
The Home Valuation Report is an in-depth analysis detailing your home's value as well as a comparison with similar homes in the area
Home Values in the Area
Average Home Value in this Area
Purchase History
| Date | Buyer | Sale Price | Title Company |
|---|---|---|---|
| Poku Osei T | -- | -- | |
| Poku Osei T | $760,000 | -- | |
| Steward Christopher | $415,000 | -- | |
| Birkmire Rex A | $375,000 | -- | |
| Young James F | $340,000 | -- | |
| Luscher John E | $285,000 | -- | |
| Eastern Mass Homes Inc | $91,348 | -- |
Source: Public Records
Mortgage History
| Date | Status | Borrower | Loan Amount |
|---|---|---|---|
| Open | Eastern Mass Homes Inc | $523,750 | |
| Closed | Eastern Mass Homes Inc | $532,915 | |
| Previous Owner | Poku Osei T | $500,000 |
Source: Public Records
Tax History
| Year | Tax Paid | Tax Assessment Tax Assessment Total Assessment is a certain percentage of the fair market value that is determined by local assessors to be the total taxable value of land and additions on the property. | Land | Improvement |
|---|---|---|---|---|
| 2025 | $12,355 | $934,600 | $301,700 | $632,900 |
| 2024 | $12,201 | $903,100 | $301,700 | $601,400 |
| 2023 | $11,588 | $815,500 | $287,400 | $528,100 |
| 2022 | $10,675 | $735,200 | $235,000 | $500,200 |
| 2021 | $10,622 | $720,600 | $228,500 | $492,100 |
| 2020 | $10,266 | $704,600 | $228,500 | $476,100 |
| 2019 | $10,177 | $692,300 | $238,200 | $454,100 |
| 2018 | $9,909 | $680,100 | $238,200 | $441,900 |
| 2017 | $9,710 | $645,600 | $232,200 | $413,400 |
| 2016 | $9,522 | $642,500 | $204,200 | $438,300 |
| 2015 | $9,544 | $628,300 | $168,300 | $460,000 |
| 2014 | $9,220 | $615,100 | $163,600 | $451,500 |
Source: Public Records
Map
Nearby Homes
- 155 South St
- 157 Central St
- 67 Carpenter St
- 233 Central St
- 13 Summerville Rd Unit 13
- 14 Baker St
- 346 South St
- 54 Main St Unit A
- 26 Fuller Rd Unit 6
- 356 Central St
- 165 Chestnut St Unit 2
- 147 Chestnut St Unit A
- 147 Chestnut St Unit B
- 5 Post Rd
- 1769 West St
- 166 Chauncy St
- 619 N Main St
- 8 Conway Ln
- 25 Kingman Ave
- 150 Rumford Ave Unit 110
- 14 Valley Forge Way
- 2 Cherry Tree Ln
- 2 N High St
- 4 N High St
- 5 Cherry Tree Ln
- 168 South St
- 12 Valley Forge Way
- 16 Valley Forge Way
- 8 N High St
- 180 South St
- 5 N High St
- 173 South St
- 164 South St
- 8 Valley Forge Way
- 15 Valley Forge Way
- 7 N High St
- 19 Valley Forge Way
- 20 Valley Forge Way
- 175 South St
- 184 South St
Your Personal Tour Guide
Ask me questions while you tour the home.