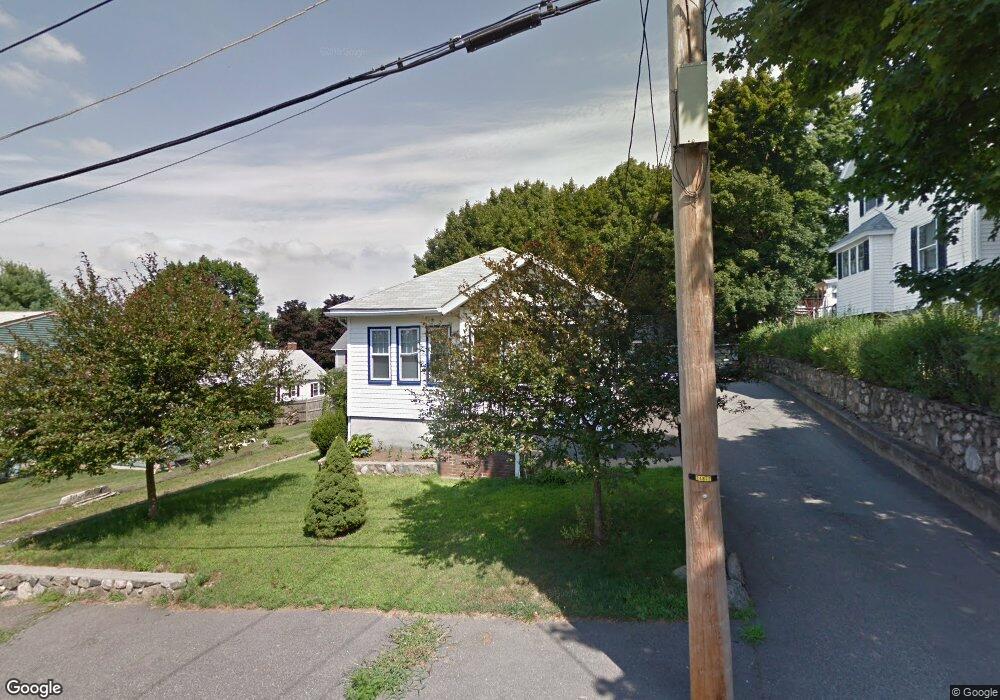
6 Clark St Woburn, MA 01801
Downtown Woburn NeighborhoodEstimated Value: $687,977 - $777,000
3
Beds
2
Baths
1,900
Sq Ft
$384/Sq Ft
Est. Value
About This Home
This home is located at 6 Clark St, Woburn, MA 01801 and is currently estimated at $729,494, approximately $383 per square foot. 6 Clark St is a home located in Middlesex County with nearby schools including Shamrock Elementary School, Daniel L. Joyce Middle School, and Woburn High School.
Ownership History
Date
Name
Owned For
Owner Type
Purchase Details
Closed on
Oct 14, 2003
Sold by
Vietro Michele and Vietro Paul
Bought by
Kurban Marilyn
Current Estimated Value
Home Financials for this Owner
Home Financials are based on the most recent Mortgage that was taken out on this home.
Original Mortgage
$322,700
Outstanding Balance
$152,036
Interest Rate
6.35%
Mortgage Type
Purchase Money Mortgage
Estimated Equity
$577,458
Purchase Details
Closed on
Mar 1, 1996
Sold by
Martin William J Est and Martin
Bought by
Pierce Michele
Create a Home Valuation Report for This Property
The Home Valuation Report is an in-depth analysis detailing your home's value as well as a comparison with similar homes in the area
Home Values in the Area
Average Home Value in this Area
Purchase History
| Date | Buyer | Sale Price | Title Company |
|---|---|---|---|
| Kurban Marilyn | $360,000 | -- | |
| Kurban Marilyn | $360,000 | -- | |
| Pierce Michele | $122,000 | -- |
Source: Public Records
Mortgage History
| Date | Status | Borrower | Loan Amount |
|---|---|---|---|
| Open | Kurban Marilyn | $322,700 | |
| Closed | Pierce Michele | $322,700 | |
| Previous Owner | Pierce Michele | $165,000 |
Source: Public Records
Tax History
| Year | Tax Paid | Tax Assessment Tax Assessment Total Assessment is a certain percentage of the fair market value that is determined by local assessors to be the total taxable value of land and additions on the property. | Land | Improvement |
|---|---|---|---|---|
| 2025 | $4,697 | $550,000 | $290,700 | $259,300 |
| 2024 | $4,322 | $536,200 | $276,900 | $259,300 |
| 2023 | $4,372 | $502,500 | $251,700 | $250,800 |
| 2022 | $4,274 | $457,600 | $218,900 | $238,700 |
| 2021 | $5,218 | $430,100 | $208,400 | $221,700 |
| 2020 | $3,775 | $405,000 | $208,400 | $196,600 |
| 2019 | $5,227 | $379,100 | $198,500 | $180,600 |
| 2018 | $3,423 | $346,100 | $182,100 | $164,000 |
| 2017 | $3,308 | $332,800 | $173,500 | $159,300 |
| 2016 | $3,159 | $314,300 | $162,100 | $152,200 |
| 2015 | $3,041 | $299,000 | $151,500 | $147,500 |
| 2014 | $2,874 | $275,300 | $151,500 | $123,800 |
Source: Public Records
Map
Nearby Homes
- 64A Mount Pleasant St
- 39 Garfield Ave
- 28 Arlington St
- 14 Garfield Ave
- 230 Main St Unit 4
- 35 Prospect St Unit 215
- 21 Eastern Ave
- 112 Wendell St
- 15 Sturgis St
- 7 Conant Rd Unit 33
- 52 Pleasant St
- 477 Main St
- 3 Frank St
- 171 Swanton St Unit 73
- 20 Arthur St
- 31 Arlington Rd Unit 6
- 136 Sylvester Ave
- 237 Swanton St
- 18 Beacon St Unit 18
- 95 Irving St