6 Clay St Colusa, CA 95932
Estimated Value: $213,000 - $308,000
2
Beds
1
Bath
1,160
Sq Ft
$236/Sq Ft
Est. Value
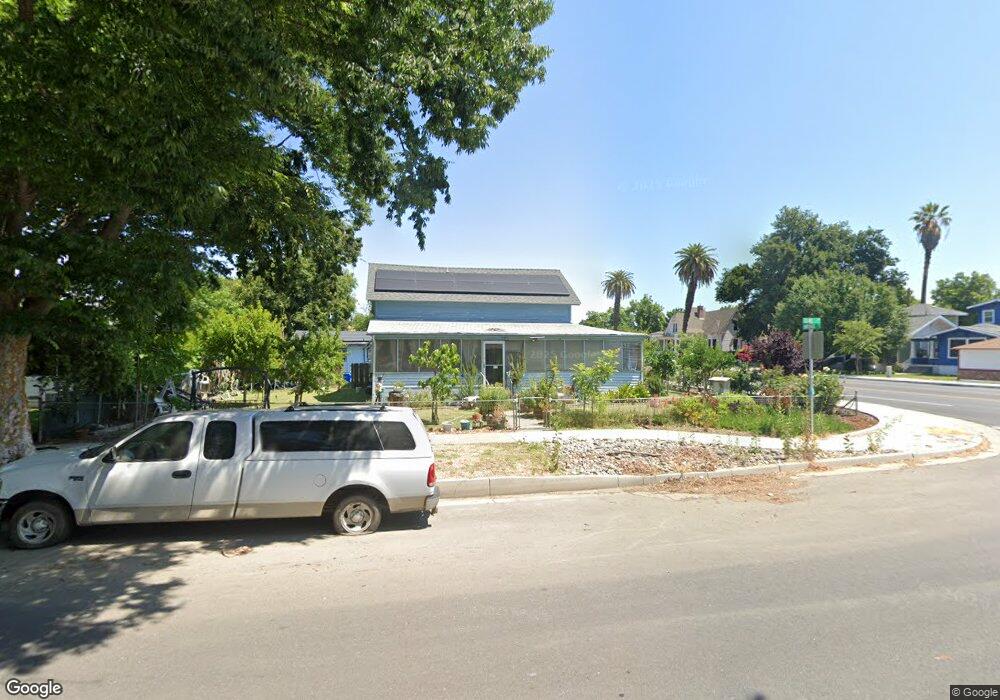
About This Home
This home is located at 6 Clay St, Colusa, CA 95932 and is currently estimated at $273,672, approximately $235 per square foot. 6 Clay St is a home located in Colusa County with nearby schools including James M. Burchfield Primary School, George T. Egling Middle School, and Colusa High School.
Ownership History
Date
Name
Owned For
Owner Type
Purchase Details
Closed on
Nov 8, 2006
Sold by
Falcon Miguel A
Bought by
Falcon Daniel and Falcon Rosenda
Current Estimated Value
Home Financials for this Owner
Home Financials are based on the most recent Mortgage that was taken out on this home.
Original Mortgage
$169,000
Interest Rate
6.36%
Mortgage Type
New Conventional
Purchase Details
Closed on
Sep 20, 2004
Sold by
Falcon Miguel A and Falcon Pedro A
Bought by
Falcon Miguel A
Home Financials for this Owner
Home Financials are based on the most recent Mortgage that was taken out on this home.
Original Mortgage
$144,000
Interest Rate
6.95%
Mortgage Type
New Conventional
Create a Home Valuation Report for This Property
The Home Valuation Report is an in-depth analysis detailing your home's value as well as a comparison with similar homes in the area
Home Values in the Area
Average Home Value in this Area
Purchase History
| Date | Buyer | Sale Price | Title Company |
|---|---|---|---|
| Falcon Daniel | -- | Alliance Title Company | |
| Falcon Miguel A | -- | North State Title Company |
Source: Public Records
Mortgage History
| Date | Status | Borrower | Loan Amount |
|---|---|---|---|
| Closed | Falcon Daniel | $169,000 | |
| Closed | Falcon Miguel A | $144,000 |
Source: Public Records
Tax History
| Year | Tax Paid | Tax Assessment Tax Assessment Total Assessment is a certain percentage of the fair market value that is determined by local assessors to be the total taxable value of land and additions on the property. | Land | Improvement |
|---|---|---|---|---|
| 2025 | $1,954 | $140,452 | $60,260 | $80,192 |
| 2024 | $1,954 | $137,699 | $59,079 | $78,620 |
| 2023 | $1,483 | $135,000 | $57,921 | $77,079 |
| 2022 | $1,745 | $132,354 | $56,786 | $75,568 |
| 2021 | $1,694 | $129,760 | $55,673 | $74,087 |
| 2020 | $2,234 | $128,431 | $55,103 | $73,328 |
| 2019 | $1,588 | $125,914 | $54,023 | $71,891 |
| 2018 | $1,360 | $123,446 | $52,964 | $70,482 |
| 2017 | $1,346 | $121,026 | $51,926 | $69,100 |
| 2016 | $1,318 | $118,654 | $50,908 | $67,746 |
| 2015 | $1,295 | $116,873 | $50,144 | $66,729 |
| 2014 | $1,233 | $114,584 | $49,162 | $65,422 |
Source: Public Records
Map
Nearby Homes
- 0 E Clay St
- 0 E Clay St
- 0 E Clay St Unit 202002708
- 0 E Clay St Unit 200907811
- 0 E Clay St Unit 11013587
- 0 E Clay St Unit 11013324
- 22 Clay St
- 34 Clay St
- 410 Bridge St
- 25 Clay St
- 508 Bridge St
- 45 E Clay St
- 54 Clay St
- 447 Bridge St
- 22 E Clay St
- 415 Bridge St
- 512 Bridge St
- 0 Bridge St
- 509 Bridge St
- 55 Clay St
Your Personal Tour Guide
Ask me questions while you tour the home.