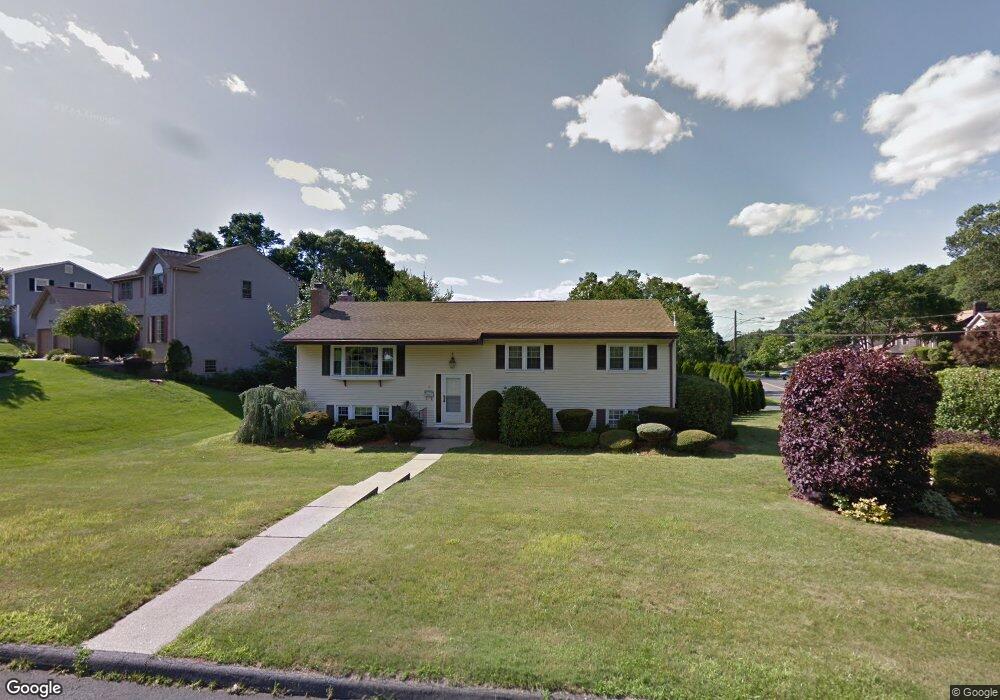
6 Coachmen Ln Newington, CT 06111
Estimated Value: $385,000 - $485,000
3
Beds
3
Baths
1,402
Sq Ft
$312/Sq Ft
Est. Value
About This Home
This home is located at 6 Coachmen Ln, Newington, CT 06111 and is currently estimated at $436,850, approximately $311 per square foot. 6 Coachmen Ln is a home located in Hartford County with nearby schools including Ruth Chaffee School, John Wallace Middle School, and Newington High School.
Ownership History
Date
Name
Owned For
Owner Type
Purchase Details
Closed on
Oct 6, 2014
Sold by
Siddique Neelofar
Bought by
Saleem Siddique T
Current Estimated Value
Purchase Details
Closed on
Apr 13, 2010
Sold by
Siddique Saleem
Bought by
Siddique Neelofar
Purchase Details
Closed on
Nov 10, 1998
Sold by
Tramadeo Kenneth V and Tramadeo Glenda L
Bought by
Siddigue Saleem
Purchase Details
Closed on
Nov 25, 1997
Sold by
Mcguiness James M and Mcguiness Susan C
Bought by
Tramadeo Kenneth and Tramadeo Glenda L
Purchase Details
Closed on
Nov 23, 1992
Sold by
Bryant Roderick and Bryant Deborah
Bought by
Mcguiness James M and Mcguiness Susan C
Purchase Details
Closed on
Dec 1, 1987
Sold by
Gamble David P
Bought by
Equitable Reloc Manag
Create a Home Valuation Report for This Property
The Home Valuation Report is an in-depth analysis detailing your home's value as well as a comparison with similar homes in the area
Home Values in the Area
Average Home Value in this Area
Purchase History
| Date | Buyer | Sale Price | Title Company |
|---|---|---|---|
| Saleem Siddique T | -- | -- | |
| Siddique Neelofar | -- | -- | |
| Siddigue Saleem | $170,000 | -- | |
| Tramadeo Kenneth | $165,000 | -- | |
| Mcguiness James M | $170,000 | -- | |
| Equitable Reloc Manag | $194,000 | -- |
Source: Public Records
Mortgage History
| Date | Status | Borrower | Loan Amount |
|---|---|---|---|
| Previous Owner | Equitable Reloc Manag | $193,516 | |
| Previous Owner | Equitable Reloc Manag | $56,000 |
Source: Public Records
Tax History Compared to Growth
Tax History
| Year | Tax Paid | Tax Assessment Tax Assessment Total Assessment is a certain percentage of the fair market value that is determined by local assessors to be the total taxable value of land and additions on the property. | Land | Improvement |
|---|---|---|---|---|
| 2025 | $7,572 | $189,390 | $64,260 | $125,130 |
| 2024 | $7,513 | $189,390 | $64,260 | $125,130 |
| 2023 | $7,265 | $189,390 | $64,260 | $125,130 |
| 2022 | $7,290 | $189,390 | $64,260 | $125,130 |
| 2021 | $7,350 | $189,390 | $64,260 | $125,130 |
| 2020 | $7,498 | $190,880 | $64,260 | $126,620 |
| 2019 | $7,530 | $190,880 | $64,260 | $126,620 |
| 2018 | $7,349 | $190,880 | $64,260 | $126,620 |
| 2017 | $6,984 | $190,880 | $64,260 | $126,620 |
| 2016 | $6,824 | $190,880 | $64,260 | $126,620 |
| 2014 | $6,694 | $192,520 | $63,970 | $128,550 |
Source: Public Records
Map
Nearby Homes
- 9 Coachmen Ln
- 22 Apple Hill
- 14 Kowal Ct
- 19 Sunnybrook Dr
- 53 Salem Dr
- 2990 Berlin Turnpike
- 2950 Berlin Turnpike
- 634 New Britain Ave
- 40 Country Side Dr
- 18 Stone Hill Dr
- 221 Westmeadow Rd
- 43 Steeplechase Dr Unit 43
- 35 Woodsedge Dr Unit 4C
- 263 Two Rod Hwy
- 15 Woodsedge Dr Unit 6C
- 15 Woodsedge Dr Unit 4B
- 120 Fox Run Ct
- 660/674 Church Rear St
- 38 Robin Brook Dr
- 326 France St
- 14 Coachmen Ln
- 221 Candlewyck Dr
- 22 Coachmen Ln
- 15 Coachmen Ln
- 228 Candlewyck Dr
- 220 Candlewyck Dr
- 238 Candlewyck Dr
- 215 Candlewyck Dr
- 32 Coachmen Ln
- 246 Candlewyck Dr
- 25 Coachmen Ln
- 256 Candlewyck Dr
- 110 Rockledge Dr
- 208 Candlewyck Dr
- 207 Candlewyck Dr
- 116 Rockledge Dr
- 29 Coachmen Ln
- 36 Coachmen Ln
- 257 Candlewyck Dr
- 264 Candlewyck Dr