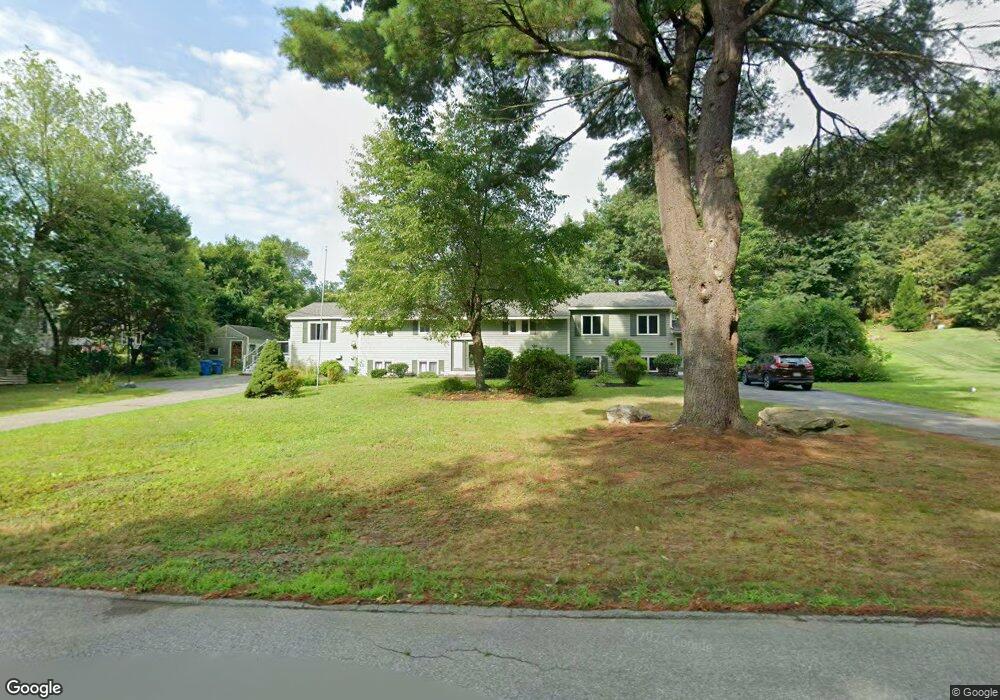
6 Cobleigh Dr Tewksbury, MA 01876
Estimated Value: $783,158 - $831,000
5
Beds
3
Baths
2,084
Sq Ft
$389/Sq Ft
Est. Value
About This Home
This home is located at 6 Cobleigh Dr, Tewksbury, MA 01876 and is currently estimated at $810,540, approximately $388 per square foot. 6 Cobleigh Dr is a home located in Middlesex County with nearby schools including John F. Ryan Elementary School, John W. Wynn Middle School, and Tewksbury Memorial High School.
Ownership History
Date
Name
Owned For
Owner Type
Purchase Details
Closed on
Oct 5, 2020
Sold by
Obrien Mary J and Obrien Thomas E
Bought by
Obrien Mary J and Obrien Thomas E
Current Estimated Value
Home Financials for this Owner
Home Financials are based on the most recent Mortgage that was taken out on this home.
Original Mortgage
$317,000
Outstanding Balance
$281,955
Interest Rate
2.9%
Mortgage Type
New Conventional
Estimated Equity
$528,585
Purchase Details
Closed on
Mar 21, 2019
Sold by
Phaneuf Edward M and Obrien Mary J
Bought by
Obrien Mary J and Obrien Thomas E
Purchase Details
Closed on
Jul 19, 1999
Sold by
Obrien Thomas E and Obrien Mary J
Bought by
Phaneuf Edward M and Phaneuf Mary Jane
Home Financials for this Owner
Home Financials are based on the most recent Mortgage that was taken out on this home.
Original Mortgage
$213,750
Interest Rate
7.39%
Mortgage Type
Purchase Money Mortgage
Create a Home Valuation Report for This Property
The Home Valuation Report is an in-depth analysis detailing your home's value as well as a comparison with similar homes in the area
Home Values in the Area
Average Home Value in this Area
Purchase History
| Date | Buyer | Sale Price | Title Company |
|---|---|---|---|
| Obrien Mary J | -- | None Available | |
| Obrien Mary J | -- | -- | |
| Phaneuf Edward M | $225,000 | -- |
Source: Public Records
Mortgage History
| Date | Status | Borrower | Loan Amount |
|---|---|---|---|
| Open | Obrien Mary J | $317,000 | |
| Previous Owner | Phaneuf Edward M | $304,000 | |
| Previous Owner | Phaneuf Edward M | $50,000 | |
| Previous Owner | Phaneuf Edward M | $213,750 |
Source: Public Records
Tax History Compared to Growth
Tax History
| Year | Tax Paid | Tax Assessment Tax Assessment Total Assessment is a certain percentage of the fair market value that is determined by local assessors to be the total taxable value of land and additions on the property. | Land | Improvement |
|---|---|---|---|---|
| 2025 | $9,899 | $748,800 | $335,900 | $412,900 |
| 2024 | $9,443 | $705,200 | $320,300 | $384,900 |
| 2023 | $9,446 | $669,900 | $291,100 | $378,800 |
| 2022 | $9,047 | $595,200 | $253,200 | $342,000 |
| 2021 | $8,709 | $554,000 | $230,100 | $323,900 |
| 2020 | $8,573 | $536,800 | $219,200 | $317,600 |
| 2019 | $8,010 | $505,700 | $208,800 | $296,900 |
| 2018 | $7,889 | $489,100 | $208,800 | $280,300 |
| 2017 | $7,527 | $461,500 | $208,800 | $252,700 |
| 2016 | $7,230 | $442,200 | $208,800 | $233,400 |
| 2015 | $6,872 | $419,800 | $199,200 | $220,600 |
| 2014 | $6,608 | $410,200 | $208,800 | $201,400 |
Source: Public Records
Map
Nearby Homes
- 9 Cobleigh Dr
- 1220 Andover St
- 115 Edgewood St
- 110 Longmeadow Dr
- 65 Martin Rd
- 5 Lawn Ave
- 188 Poland Ave
- 186 Burnham Rd
- 241 Remington St
- 149 Merrimack Meadows Ln Unit 149
- 512 Merrimack Ave
- 198 Trull Ln E
- 210 River Rd
- 103 Westwind Rd
- 70 Enfield St
- 821 Merrimack Ave
- 15 Sharyn Cir
- 995 North St
- 26 Luce St
- 4 Francis Dr Unit 105