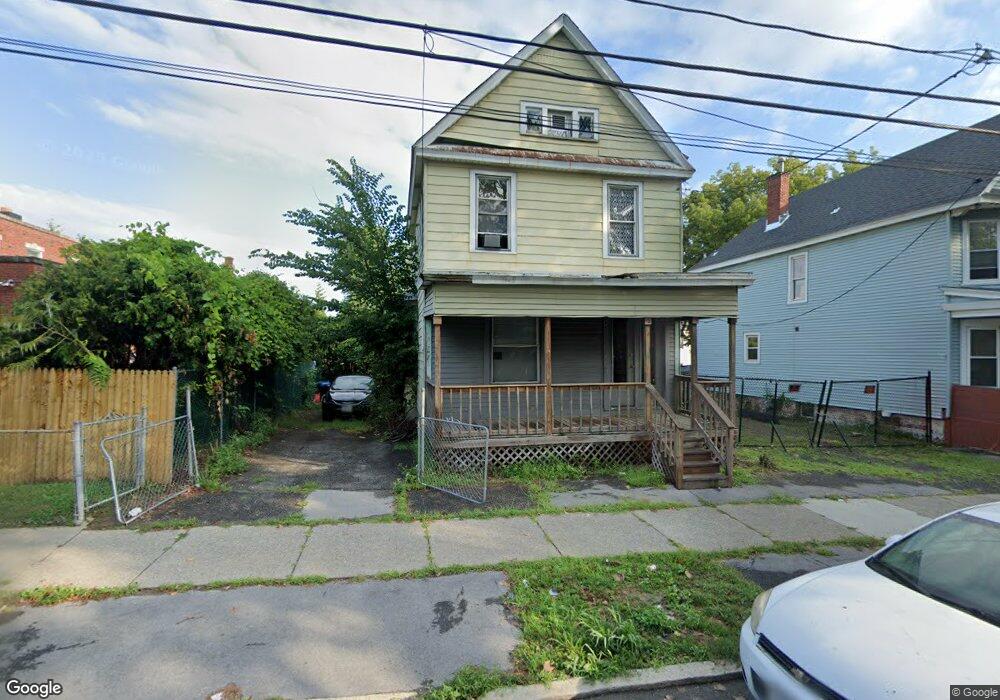
6 Colby St Albany, NY 12206
West End NeighborhoodEstimated Value: $139,000 - $243,000
4
Beds
2
Baths
1,586
Sq Ft
$125/Sq Ft
Est. Value
About This Home
This home is located at 6 Colby St, Albany, NY 12206 and is currently estimated at $197,554, approximately $124 per square foot. 6 Colby St is a home located in Albany County with nearby schools including Pine Hills Elementary School, Stephen And Harriet Myers Middle School, and Albany High School.
Ownership History
Date
Name
Owned For
Owner Type
Purchase Details
Closed on
Dec 18, 2006
Sold by
Greenwich Investors Xvi Llc
Bought by
Clemmer Ericka
Current Estimated Value
Home Financials for this Owner
Home Financials are based on the most recent Mortgage that was taken out on this home.
Original Mortgage
$73,518
Outstanding Balance
$44,052
Interest Rate
6.35%
Estimated Equity
$153,502
Purchase Details
Closed on
Dec 5, 2006
Sold by
Greenwich Investors Xvi Llc
Bought by
Clemmer Ericka
Home Financials for this Owner
Home Financials are based on the most recent Mortgage that was taken out on this home.
Original Mortgage
$73,518
Outstanding Balance
$44,052
Interest Rate
6.35%
Estimated Equity
$153,502
Purchase Details
Closed on
Jul 12, 2005
Sold by
Beneficial Mortgage Cor
Bought by
Greenwich Investors Xvi Llc
Purchase Details
Closed on
May 3, 2005
Create a Home Valuation Report for This Property
The Home Valuation Report is an in-depth analysis detailing your home's value as well as a comparison with similar homes in the area
Home Values in the Area
Average Home Value in this Area
Purchase History
| Date | Buyer | Sale Price | Title Company |
|---|---|---|---|
| Clemmer Ericka | $74,100 | Jeanne Heran | |
| Clemmer Ericka | $74,500 | None Available | |
| Greenwich Investors Xvi Llc | $25,000 | -- | |
| -- | $62,928 | -- |
Source: Public Records
Mortgage History
| Date | Status | Borrower | Loan Amount |
|---|---|---|---|
| Open | Clemmer Ericka | $73,518 |
Source: Public Records
Tax History Compared to Growth
Tax History
| Year | Tax Paid | Tax Assessment Tax Assessment Total Assessment is a certain percentage of the fair market value that is determined by local assessors to be the total taxable value of land and additions on the property. | Land | Improvement |
|---|---|---|---|---|
| 2024 | $3,162 | $127,000 | $25,400 | $101,600 |
| 2023 | $2,797 | $82,000 | $16,000 | $66,000 |
| 2022 | $2,659 | $82,000 | $16,000 | $66,000 |
| 2021 | $2,628 | $82,000 | $16,000 | $66,000 |
| 2020 | $2,715 | $82,000 | $16,000 | $66,000 |
| 2019 | $3,228 | $82,000 | $16,000 | $66,000 |
| 2018 | $2,723 | $82,000 | $16,000 | $66,000 |
| 2017 | $1,210 | $82,000 | $16,000 | $66,000 |
| 2016 | $2,801 | $82,000 | $16,000 | $66,000 |
| 2015 | $2,724 | $81,500 | $16,300 | $65,200 |
| 2014 | -- | $81,500 | $16,300 | $65,200 |
Source: Public Records
Map
Nearby Homes
- 40 Garfield Place
- 38 Garfield Place
- 21 Watervliet Ave
- 30 Willow St
- 857 Livingston Ave
- 3 Manning Square
- 9 N Manning Blvd
- 15 N Manning Blvd
- 50 N Manning Blvd
- 37-39 N Manning Blvd
- 41-43 N Manning Blvd
- 53 N Manning Blvd
- 596 3rd St
- 61 Lincoln Ave
- 587 3rd St
- 15 Buchanan St
- 349 Manning Blvd
- 282 Manning Blvd
- 107 Kent St
- 184 Benson St