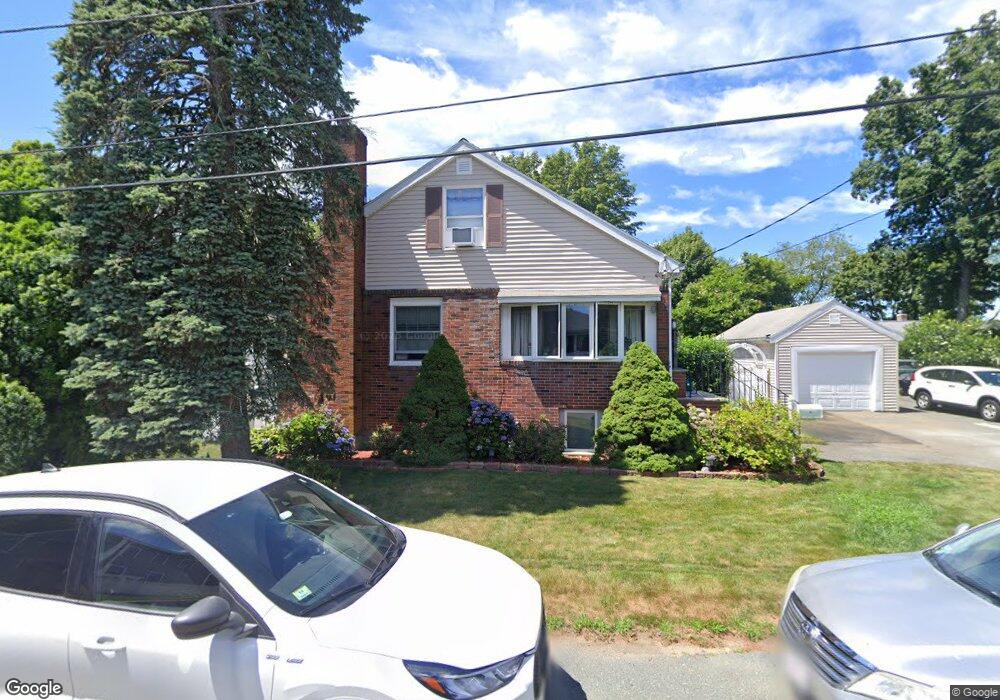
6 Conway St Beverly, MA 01915
North Beverly NeighborhoodEstimated Value: $703,000 - $814,000
5
Beds
2
Baths
2,188
Sq Ft
$336/Sq Ft
Est. Value
About This Home
This home is located at 6 Conway St, Beverly, MA 01915 and is currently estimated at $735,115, approximately $335 per square foot. 6 Conway St is a home located in Essex County with nearby schools including Beverly High School, The Saints Academy, and Shore Country Day School.
Ownership History
Date
Name
Owned For
Owner Type
Purchase Details
Closed on
Jan 13, 2010
Sold by
Galiatsatos Paul G and Galiatsatos Linda A
Bought by
Galiatsatos Paul G
Current Estimated Value
Purchase Details
Closed on
Jul 23, 2008
Sold by
6 Conway Rt and Galiatsatos
Bought by
Galiatsatos Paul G
Purchase Details
Closed on
Apr 11, 2008
Sold by
Galiatsatos Linda and Galiatsatos Paul G
Bought by
6 Conway Rt
Purchase Details
Closed on
Jan 10, 1979
Bought by
Galiatsatos Paul G and Retos Deborah J
Create a Home Valuation Report for This Property
The Home Valuation Report is an in-depth analysis detailing your home's value as well as a comparison with similar homes in the area
Home Values in the Area
Average Home Value in this Area
Purchase History
| Date | Buyer | Sale Price | Title Company |
|---|---|---|---|
| Galiatsatos Paul G | -- | -- | |
| Galiatsatos Paul G | -- | -- | |
| 6 Conway Rt | -- | -- | |
| Galiatsatos Paul G | $41,000 | -- |
Source: Public Records
Mortgage History
| Date | Status | Borrower | Loan Amount |
|---|---|---|---|
| Open | Galiatsatos Paul G | $272,000 | |
| Closed | Galiatsatos Paul G | $37,000 |
Source: Public Records
Tax History
| Year | Tax Paid | Tax Assessment Tax Assessment Total Assessment is a certain percentage of the fair market value that is determined by local assessors to be the total taxable value of land and additions on the property. | Land | Improvement |
|---|---|---|---|---|
| 2025 | $6,450 | $586,900 | $368,500 | $218,400 |
| 2024 | $6,169 | $549,300 | $330,900 | $218,400 |
| 2023 | $5,931 | $526,700 | $308,300 | $218,400 |
| 2022 | $5,748 | $472,300 | $253,800 | $218,500 |
| 2021 | $5,340 | $420,500 | $223,700 | $196,800 |
| 2020 | $5,289 | $403,600 | $206,800 | $196,800 |
| 2019 | $5,199 | $390,600 | $191,800 | $198,800 |
| 2018 | $4,986 | $366,600 | $188,000 | $178,600 |
| 2017 | $4,644 | $325,200 | $146,600 | $178,600 |
| 2016 | $4,518 | $314,000 | $135,400 | $178,600 |
| 2015 | $4,431 | $314,000 | $135,400 | $178,600 |
Source: Public Records
Map
Nearby Homes
- 50 Balch St Unit 300
- 50 Balch St Unit 209
- 50 Balch St Unit 103
- 13 Giles Ave Unit 2
- 412 Cabot St
- 4 Duck Pond Rd Unit 225
- 9 Swan St Unit 2
- 6 Charles St
- 348 Rantoul St Unit 202
- 61 Ellsworth Ave
- 34 Chase St
- 123 Livingstone Ave
- 315 Rantoul St Unit 406
- 125 Livingstone Ave
- 261 Rantoul St
- 6 Pilgrim Heights
- 40 Heather St Unit 204
- 17 Pond St
- 44 Foster St
- The Cabot Collection
Your Personal Tour Guide
Ask me questions while you tour the home.