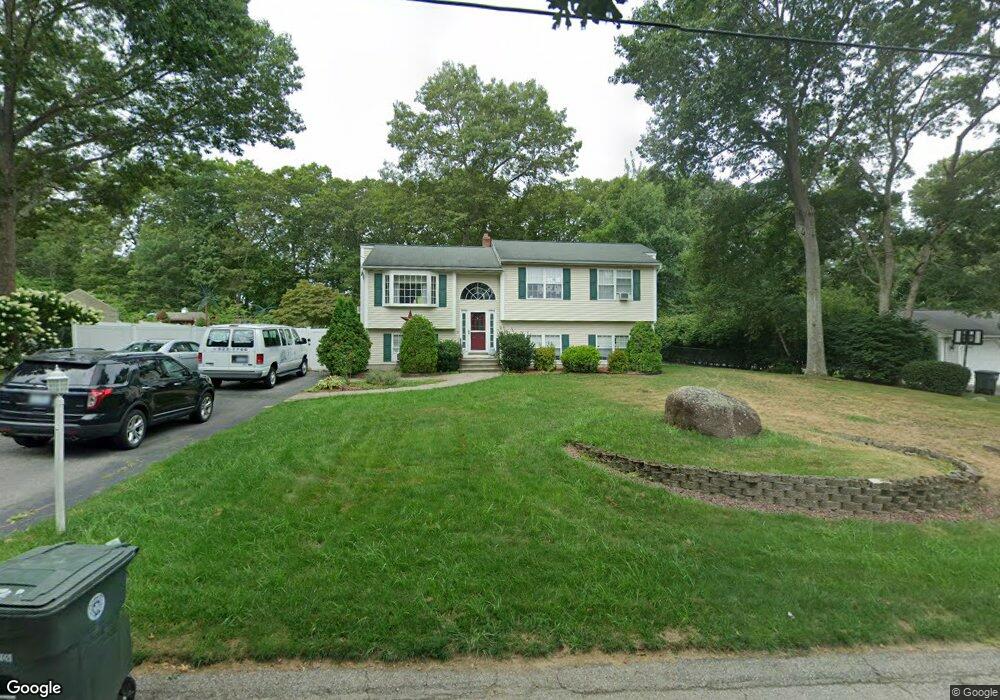
6 Cote Ct Unit 3 Coventry, RI 02816
Estimated Value: $505,661 - $672,000
2
Beds
2
Baths
1,670
Sq Ft
$342/Sq Ft
Est. Value
About This Home
This home is located at 6 Cote Ct Unit 3, Coventry, RI 02816 and is currently estimated at $571,915, approximately $342 per square foot. 6 Cote Ct Unit 3 is a home located in Kent County with nearby schools including Alan Shawn Feinstein Ms Of Cov, Coventry High School, and Father John V. Doyle School.
Ownership History
Date
Name
Owned For
Owner Type
Purchase Details
Closed on
Jul 26, 2023
Sold by
Raspallo Thomas S and Raspallo Jaclyn
Bought by
S T
Current Estimated Value
Purchase Details
Closed on
Nov 25, 2020
Sold by
Smith Lisa A and Smith Thomas C
Bought by
Raspallo Thomas S and Raspallo Jaclyn
Home Financials for this Owner
Home Financials are based on the most recent Mortgage that was taken out on this home.
Original Mortgage
$285,000
Interest Rate
2.8%
Mortgage Type
New Conventional
Purchase Details
Closed on
Aug 30, 1995
Sold by
Major Rlty Llc
Bought by
Smith Thomas C and Smith Lisa
Create a Home Valuation Report for This Property
The Home Valuation Report is an in-depth analysis detailing your home's value as well as a comparison with similar homes in the area
Purchase History
| Date | Buyer | Sale Price | Title Company |
|---|---|---|---|
| S T | -- | None Available | |
| Raspallo Thomas S | $413,000 | None Available | |
| Smith Thomas C | $130,000 | -- |
Source: Public Records
Mortgage History
| Date | Status | Borrower | Loan Amount |
|---|---|---|---|
| Previous Owner | Raspallo Thomas S | $285,000 | |
| Previous Owner | Smith Thomas C | $18,846 | |
| Previous Owner | Smith Thomas C | $223,300 |
Source: Public Records
Tax History
| Year | Tax Paid | Tax Assessment Tax Assessment Total Assessment is a certain percentage of the fair market value that is determined by local assessors to be the total taxable value of land and additions on the property. | Land | Improvement |
|---|---|---|---|---|
| 2025 | $6,487 | $403,200 | $140,900 | $262,300 |
| 2024 | $6,479 | $409,000 | $140,900 | $268,100 |
| 2023 | $6,270 | $409,000 | $140,900 | $268,100 |
| 2022 | $6,423 | $328,200 | $135,500 | $192,700 |
| 2021 | $6,367 | $328,200 | $135,500 | $192,700 |
| 2020 | $7,299 | $328,200 | $135,500 | $192,700 |
| 2019 | $6,383 | $287,000 | $113,700 | $173,300 |
| 2018 | $6,202 | $287,000 | $113,700 | $173,300 |
| 2017 | $6,021 | $287,000 | $113,700 | $173,300 |
| 2016 | $5,297 | $247,400 | $94,700 | $152,700 |
| 2015 | $5,153 | $247,400 | $94,700 | $152,700 |
| 2014 | $2,695 | $247,400 | $94,700 | $152,700 |
| 2013 | $4,824 | $258,500 | $93,400 | $165,100 |
Source: Public Records
Map
Nearby Homes
- 91 Windsor Park Dr
- 27 Matteson St
- 55 Columbia Ave
- 21 Darton St
- 27 Mead St
- 420 Washington St
- 39 Mohawk St
- 22 Rawlinson Dr
- 31 Anthony St Unit 33
- 131 Pawtuxet Terrace
- 123 Doolittle St
- 58 Read Ave
- 54 Arthur St
- 22 Colorado St
- 87 Bates Ave
- 76 Tiogue Ave
- 2 Ritchotte Ct
- 11 Kennedy Dr
- 6 Field Ave
- 77 Macarthur Blvd
- 6 Cote Ct
- 8 Cote Ct
- 4 Cote Ct
- 0 Cote Ct Unit 618785
- 0 Cote Ct Unit 623333
- 0 Cote Ct Unit 811593
- 0 Cote Ct Unit 1242699
- 5 Cote Ct
- 3 Cote Ct
- 151 Princeton Ave
- 2 Cote Ct
- 10 1/2 Cote Ct
- 10 Cote Ct
- 80 Sheltra Ave
- 153 Princeton Ave
- 1 Cote Ct
- 149 Princeton Ave
- 155 Princeton Ave
- 86 Sheltra Ave
- 82 Sheltra Ave
Your Personal Tour Guide
Ask me questions while you tour the home.