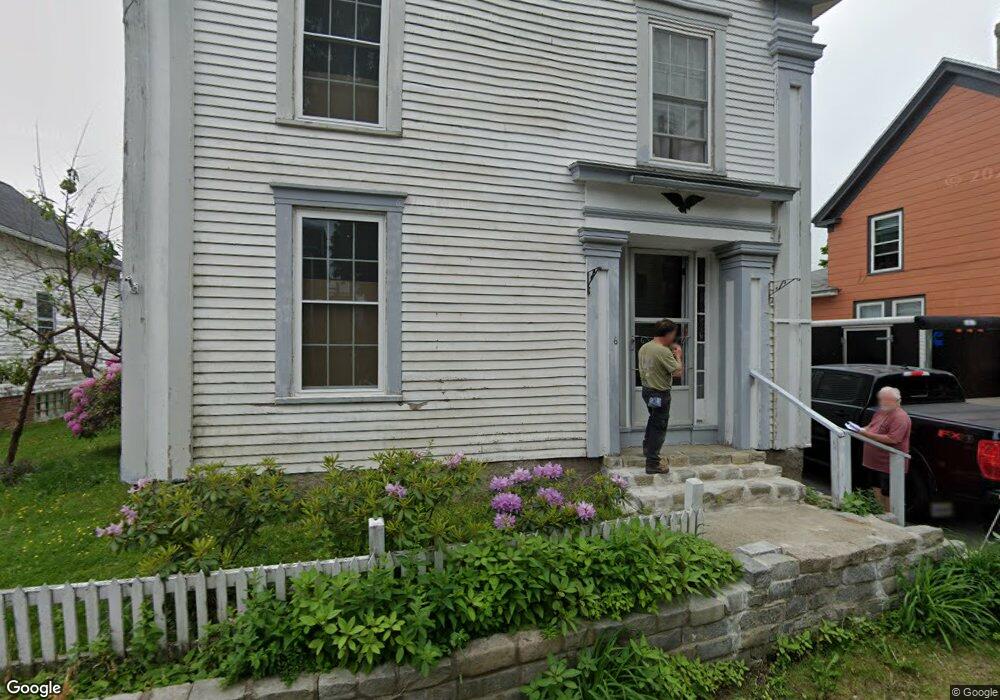
6 Cottage St Rockland, ME 04841
Estimated Value: $338,000 - $398,000
3
Beds
2
Baths
1,820
Sq Ft
$206/Sq Ft
Est. Value
About This Home
This home is located at 6 Cottage St, Rockland, ME 04841 and is currently estimated at $374,673, approximately $205 per square foot. 6 Cottage St is a home located in Knox County with nearby schools including South School, Oceanside High School East, and Pen Bay Christian School.
Ownership History
Date
Name
Owned For
Owner Type
Purchase Details
Closed on
May 6, 2024
Sold by
Dukes Charles J and Wang Nanfei
Bought by
C Dukes & Nanfei Wang Lt and Dukes
Current Estimated Value
Purchase Details
Closed on
Jun 29, 2011
Sold by
Edwards William J Est
Bought by
Dukes Charles J and Wang Nanfei
Home Financials for this Owner
Home Financials are based on the most recent Mortgage that was taken out on this home.
Original Mortgage
$70,000
Interest Rate
4.62%
Mortgage Type
Purchase Money Mortgage
Create a Home Valuation Report for This Property
The Home Valuation Report is an in-depth analysis detailing your home's value as well as a comparison with similar homes in the area
Home Values in the Area
Average Home Value in this Area
Purchase History
| Date | Buyer | Sale Price | Title Company |
|---|---|---|---|
| C Dukes & Nanfei Wang Lt | -- | None Available | |
| C Dukes & Nanfei Wang Lt | -- | None Available | |
| Dukes Charles J | -- | -- | |
| Dukes Charles J | -- | -- |
Source: Public Records
Mortgage History
| Date | Status | Borrower | Loan Amount |
|---|---|---|---|
| Previous Owner | Dukes Charles J | $70,000 |
Source: Public Records
Tax History Compared to Growth
Tax History
| Year | Tax Paid | Tax Assessment Tax Assessment Total Assessment is a certain percentage of the fair market value that is determined by local assessors to be the total taxable value of land and additions on the property. | Land | Improvement |
|---|---|---|---|---|
| 2024 | $4,433 | $181,100 | $34,900 | $146,200 |
| 2023 | $4,395 | $181,100 | $34,900 | $146,200 |
| 2022 | $4,395 | $181,100 | $34,900 | $146,200 |
| 2021 | $4,093 | $181,100 | $34,900 | $146,200 |
| 2020 | $4,039 | $181,100 | $34,900 | $146,200 |
| 2019 | $3,959 | $159,900 | $25,500 | $134,400 |
| 2018 | $3,690 | $159,900 | $25,500 | $134,400 |
| 2017 | $3,563 | $159,900 | $25,500 | $134,400 |
| 2016 | $3,473 | $159,900 | $25,500 | $134,400 |
| 2015 | $3,390 | $159,900 | $25,500 | $134,400 |
| 2014 | $3,224 | $159,900 | $25,500 | $134,400 |
| 2013 | $3,121 | $159,900 | $25,500 | $134,400 |
Source: Public Records
Map
Nearby Homes