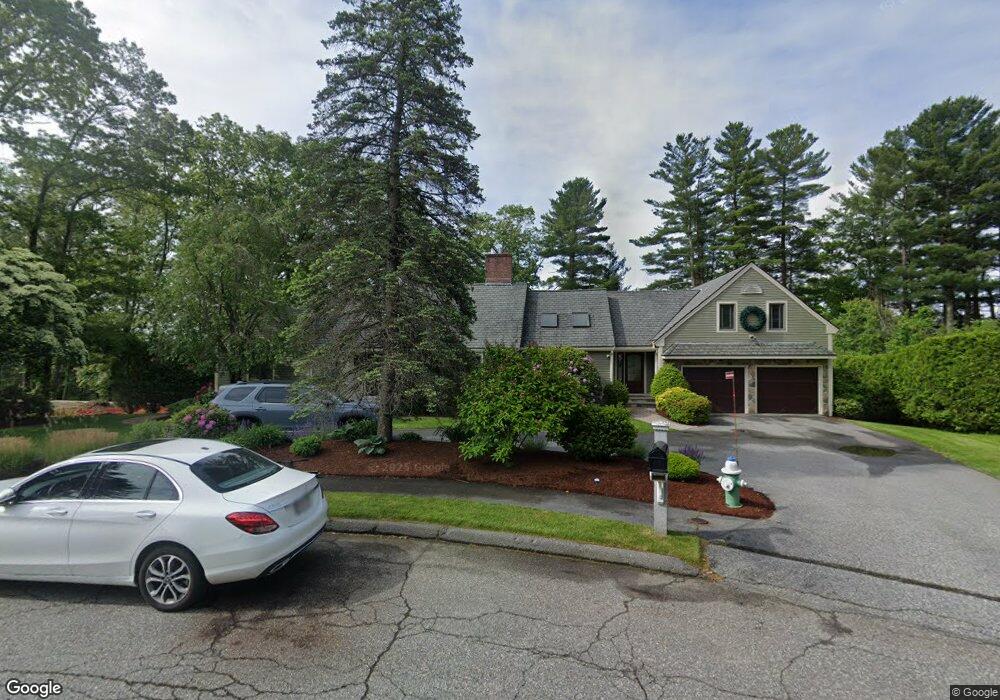
6 Cranberry Ln Lynnfield, MA 01940
Estimated Value: $1,733,000 - $2,017,000
3
Beds
4
Baths
5,331
Sq Ft
$349/Sq Ft
Est. Value
About This Home
This home is located at 6 Cranberry Ln, Lynnfield, MA 01940 and is currently estimated at $1,862,310, approximately $349 per square foot. 6 Cranberry Ln is a home located in Essex County with nearby schools including Lynnfield Middle School, Pickering Middle School, and Lynnfield High School.
Ownership History
Date
Name
Owned For
Owner Type
Purchase Details
Closed on
Mar 20, 2012
Sold by
Coletta Steven and Coletta Maryann A
Bought by
Smc Rt and Coletta Steven T
Current Estimated Value
Home Financials for this Owner
Home Financials are based on the most recent Mortgage that was taken out on this home.
Original Mortgage
$350,000
Outstanding Balance
$240,311
Interest Rate
3.86%
Mortgage Type
New Conventional
Estimated Equity
$1,621,999
Purchase Details
Closed on
Oct 22, 1998
Sold by
Durgan Richard F and Durgan Cheryl H
Bought by
Coletta Steven T and Coletta Maryann
Purchase Details
Closed on
Nov 30, 1987
Sold by
Wills Charles B
Bought by
Durgan Richard F
Create a Home Valuation Report for This Property
The Home Valuation Report is an in-depth analysis detailing your home's value as well as a comparison with similar homes in the area
Home Values in the Area
Average Home Value in this Area
Purchase History
| Date | Buyer | Sale Price | Title Company |
|---|---|---|---|
| Smc Rt | -- | -- | |
| Coletta Steven T | -- | -- | |
| Coletta Steven T | $599,900 | -- | |
| Durgan Richard F | $572,300 | -- |
Source: Public Records
Mortgage History
| Date | Status | Borrower | Loan Amount |
|---|---|---|---|
| Open | Durgan Richard F | $150,000 | |
| Open | Durgan Richard F | $350,000 |
Source: Public Records
Tax History Compared to Growth
Tax History
| Year | Tax Paid | Tax Assessment Tax Assessment Total Assessment is a certain percentage of the fair market value that is determined by local assessors to be the total taxable value of land and additions on the property. | Land | Improvement |
|---|---|---|---|---|
| 2025 | $14,999 | $1,420,400 | $746,500 | $673,900 |
| 2024 | $13,852 | $1,318,000 | $691,200 | $626,800 |
| 2023 | $13,558 | $1,199,800 | $632,000 | $567,800 |
| 2022 | $13,341 | $1,112,700 | $632,000 | $480,700 |
| 2021 | $13,391 | $1,009,100 | $553,000 | $456,100 |
| 2020 | $13,076 | $939,400 | $502,400 | $437,000 |
| 2019 | $12,672 | $911,000 | $474,000 | $437,000 |
| 2018 | $12,535 | $911,000 | $474,000 | $437,000 |
| 2017 | $12,554 | $911,000 | $474,000 | $437,000 |
| 2016 | $12,248 | $844,700 | $404,900 | $439,800 |
| 2015 | $12,240 | $844,700 | $404,900 | $439,800 |
Source: Public Records
Map
Nearby Homes