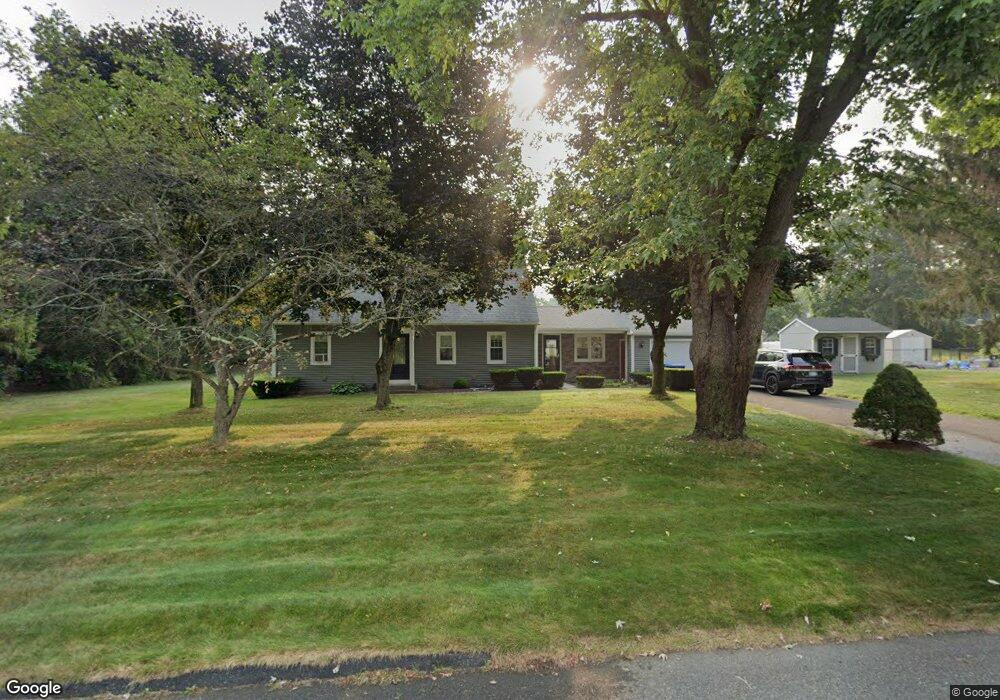
6 Crest St Wilbraham, MA 01095
Estimated Value: $501,757 - $549,000
4
Beds
2
Baths
2,232
Sq Ft
$233/Sq Ft
Est. Value
About This Home
This home is located at 6 Crest St, Wilbraham, MA 01095 and is currently estimated at $519,689, approximately $232 per square foot. 6 Crest St is a home located in Hampden County with nearby schools including Minnechaug Regional High School, Springfield International Charter School, and Wilbraham & Monson Academy.
Ownership History
Date
Name
Owned For
Owner Type
Purchase Details
Closed on
Jul 15, 2025
Sold by
Moore Daniel C and Moore Carolyn
Bought by
Moore Ft and Moore
Current Estimated Value
Purchase Details
Closed on
Sep 16, 2010
Sold by
Brundrett Doris H
Bought by
Moore Daniel C and Moore Carolyn
Home Financials for this Owner
Home Financials are based on the most recent Mortgage that was taken out on this home.
Original Mortgage
$245,000
Interest Rate
4.51%
Mortgage Type
Purchase Money Mortgage
Create a Home Valuation Report for This Property
The Home Valuation Report is an in-depth analysis detailing your home's value as well as a comparison with similar homes in the area
Home Values in the Area
Average Home Value in this Area
Purchase History
| Date | Buyer | Sale Price | Title Company |
|---|---|---|---|
| Moore Ft | -- | -- | |
| Moore Ft | -- | -- | |
| Moore Daniel C | $265,000 | -- | |
| Moore Daniel C | $265,000 | -- |
Source: Public Records
Mortgage History
| Date | Status | Borrower | Loan Amount |
|---|---|---|---|
| Previous Owner | Moore Daniel C | $245,000 | |
| Previous Owner | Moore Daniel C | $25,000 | |
| Previous Owner | Moore Daniel C | $55,000 |
Source: Public Records
Tax History Compared to Growth
Tax History
| Year | Tax Paid | Tax Assessment Tax Assessment Total Assessment is a certain percentage of the fair market value that is determined by local assessors to be the total taxable value of land and additions on the property. | Land | Improvement |
|---|---|---|---|---|
| 2025 | $8,103 | $453,200 | $99,600 | $353,600 |
| 2024 | $7,470 | $403,800 | $99,600 | $304,200 |
| 2023 | $7,510 | $377,800 | $99,600 | $278,200 |
| 2022 | $7,510 | $366,500 | $99,600 | $266,900 |
| 2021 | $7,416 | $323,000 | $106,900 | $216,100 |
| 2020 | $7,034 | $314,300 | $106,900 | $207,400 |
| 2019 | $6,852 | $314,300 | $106,900 | $207,400 |
| 2018 | $6,575 | $290,400 | $106,900 | $183,500 |
| 2017 | $6,389 | $290,400 | $106,900 | $183,500 |
| 2016 | $5,871 | $271,800 | $118,600 | $153,200 |
| 2015 | $5,675 | $271,800 | $118,600 | $153,200 |
Source: Public Records
Map
Nearby Homes