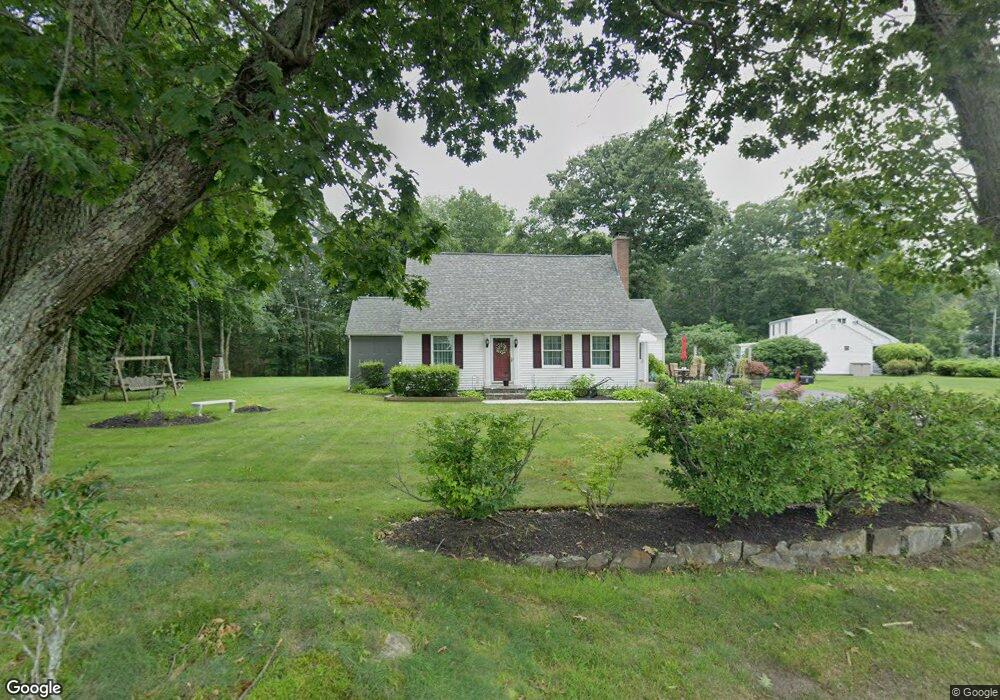
6 Crystal St Paxton, MA 01612
Estimated Value: $457,000 - $483,000
2
Beds
3
Baths
1,680
Sq Ft
$278/Sq Ft
Est. Value
About This Home
This home is located at 6 Crystal St, Paxton, MA 01612 and is currently estimated at $467,196, approximately $278 per square foot. 6 Crystal St is a home located in Worcester County with nearby schools including Wachusett Regional High School and Worcester Seventh-Day Adventist School.
Ownership History
Date
Name
Owned For
Owner Type
Purchase Details
Closed on
May 28, 1998
Sold by
Hurney Mae M Est and Gentile
Bought by
Martin Christine M
Current Estimated Value
Home Financials for this Owner
Home Financials are based on the most recent Mortgage that was taken out on this home.
Original Mortgage
$55,000
Interest Rate
7.12%
Mortgage Type
Purchase Money Mortgage
Create a Home Valuation Report for This Property
The Home Valuation Report is an in-depth analysis detailing your home's value as well as a comparison with similar homes in the area
Home Values in the Area
Average Home Value in this Area
Purchase History
| Date | Buyer | Sale Price | Title Company |
|---|---|---|---|
| Martin Christine M | $30,000 | -- |
Source: Public Records
Mortgage History
| Date | Status | Borrower | Loan Amount |
|---|---|---|---|
| Open | Martin Christine M | $65,000 | |
| Closed | Martin Christine M | $36,000 | |
| Closed | Martin Christine M | $55,000 |
Source: Public Records
Tax History Compared to Growth
Tax History
| Year | Tax Paid | Tax Assessment Tax Assessment Total Assessment is a certain percentage of the fair market value that is determined by local assessors to be the total taxable value of land and additions on the property. | Land | Improvement |
|---|---|---|---|---|
| 2025 | $5,948 | $403,500 | $100,800 | $302,700 |
| 2024 | $5,912 | $367,900 | $100,800 | $267,100 |
| 2023 | $5,981 | $340,200 | $91,800 | $248,400 |
| 2022 | $5,462 | $287,800 | $91,800 | $196,000 |
| 2021 | $6,557 | $274,000 | $83,600 | $190,400 |
| 2020 | $5,254 | $266,300 | $75,900 | $190,400 |
| 2019 | $5,123 | $259,500 | $69,100 | $190,400 |
| 2018 | $5,740 | $229,200 | $65,700 | $163,500 |
| 2017 | $3,597 | $176,400 | $62,600 | $113,800 |
| 2016 | $3,494 | $169,700 | $62,600 | $107,100 |
| 2015 | $3,451 | $166,000 | $62,600 | $103,400 |
| 2014 | $3,353 | $163,500 | $62,600 | $100,900 |
Source: Public Records
Map
Nearby Homes
- 55 Central Ave
- 44 Camp St
- 45 Camp St
- 5 Woodland Dr
- 267 Pleasant St
- 309 Pleasant St
- 58 Wedgewood Rd
- 15 Briarcliff Ln
- 5 Edwidge St
- 20 Wedgewood Rd
- 416 Pleasant St
- 27 Brewster Rd
- 10 Joppa Rd
- 15 Wildrose Ave
- 9 Newburn Rd
- 155 Tory Fort Ln
- Lot A Paxton St
- 148A Tory Fort Ln
- 17 Crowningshield Dr
- 122 Copperfield Rd