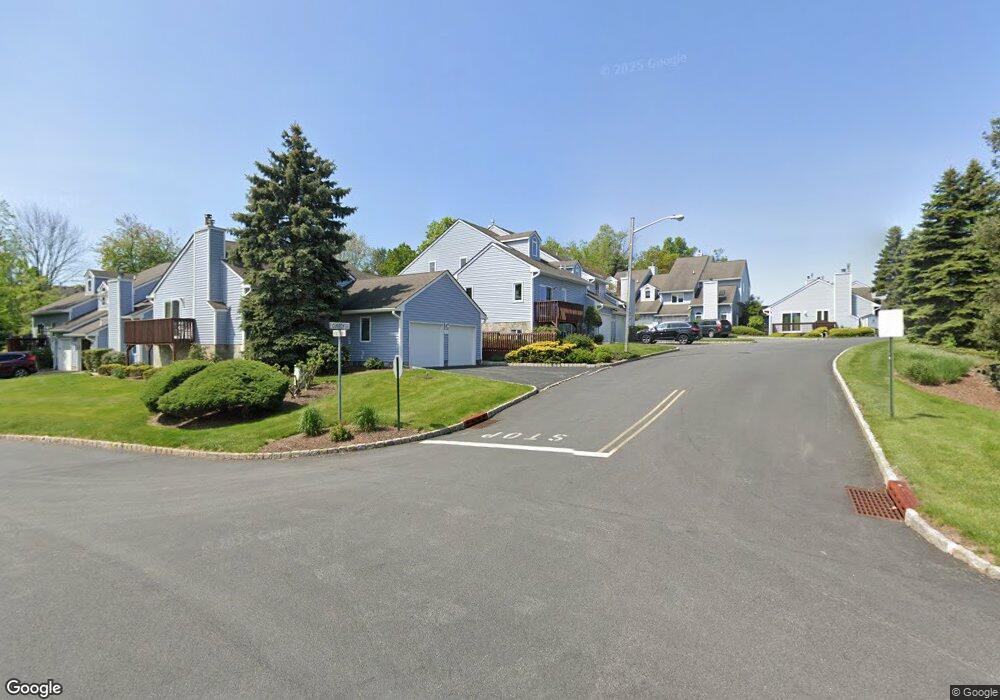
6 Currey Ln Unit 224 West Orange, NJ 07052
Estimated Value: $656,481 - $675,000
--
Bed
--
Bath
2,200
Sq Ft
$302/Sq Ft
Est. Value
About This Home
This home is located at 6 Currey Ln Unit 224, West Orange, NJ 07052 and is currently estimated at $663,370, approximately $301 per square foot. 6 Currey Ln Unit 224 is a home located in Essex County with nearby schools including West Orange High School, Our Lady of the Lake School, and Mount Carmel Guild High School.
Ownership History
Date
Name
Owned For
Owner Type
Purchase Details
Closed on
Jul 16, 2009
Sold by
Kaplan Matthew R and Kaplan Julie Sobel
Bought by
Weinshank Matthew B and Weinshank Lauryn R
Current Estimated Value
Home Financials for this Owner
Home Financials are based on the most recent Mortgage that was taken out on this home.
Original Mortgage
$344,000
Outstanding Balance
$227,577
Interest Rate
5.58%
Mortgage Type
New Conventional
Estimated Equity
$435,793
Purchase Details
Closed on
Jun 23, 2000
Sold by
Pomerantz Bruce
Bought by
Davis Ronald and Sambur Helen
Home Financials for this Owner
Home Financials are based on the most recent Mortgage that was taken out on this home.
Original Mortgage
$200,000
Interest Rate
8.55%
Purchase Details
Closed on
Nov 15, 1996
Sold by
Highlands W Essex
Bought by
Pomerantz Bruce and Pomeranz Rochelel
Home Financials for this Owner
Home Financials are based on the most recent Mortgage that was taken out on this home.
Original Mortgage
$145,000
Interest Rate
7.81%
Create a Home Valuation Report for This Property
The Home Valuation Report is an in-depth analysis detailing your home's value as well as a comparison with similar homes in the area
Home Values in the Area
Average Home Value in this Area
Purchase History
| Date | Buyer | Sale Price | Title Company |
|---|---|---|---|
| Weinshank Matthew B | $465,000 | Fidelity Natl Title Ins Co | |
| Davis Ronald | $314,000 | -- | |
| Pomerantz Bruce | $247,000 | -- |
Source: Public Records
Mortgage History
| Date | Status | Borrower | Loan Amount |
|---|---|---|---|
| Open | Weinshank Matthew B | $344,000 | |
| Previous Owner | Davis Ronald | $200,000 | |
| Previous Owner | Pomerantz Bruce | $145,000 |
Source: Public Records
Tax History Compared to Growth
Tax History
| Year | Tax Paid | Tax Assessment Tax Assessment Total Assessment is a certain percentage of the fair market value that is determined by local assessors to be the total taxable value of land and additions on the property. | Land | Improvement |
|---|---|---|---|---|
| 2025 | $16,355 | $536,500 | $230,000 | $306,500 |
| 2024 | $16,355 | $355,700 | $115,000 | $240,700 |
| 2022 | $15,782 | $355,700 | $115,000 | $240,700 |
| 2021 | $15,487 | $355,700 | $115,000 | $240,700 |
| 2020 | $15,238 | $355,700 | $115,000 | $240,700 |
| 2019 | $14,801 | $355,700 | $115,000 | $240,700 |
| 2018 | $14,363 | $355,700 | $115,000 | $240,700 |
| 2017 | $14,178 | $355,700 | $115,000 | $240,700 |
| 2016 | $13,837 | $355,700 | $115,000 | $240,700 |
| 2015 | $13,577 | $355,700 | $115,000 | $240,700 |
| 2014 | $13,310 | $355,700 | $115,000 | $240,700 |
Source: Public Records
Map
Nearby Homes
- 19 Currey Ln
- 31 Currey Ln Unit 180
- 33 Knutsen Dr Unit 212
- 6 Bayowski Rd
- 14 Bongart Dr
- 9 Rappleye Ct
- 2 Kinzel Ln
- 6 Wakeman St
- 8 Mullarkey Dr Unit 148
- 7 Shrump Place
- 31 Rosemont Terrace
- 4 Rosemont Ct
- 11 Gerdes Ave
- 12 Ahern Way
- 153 Morningside Rd
- 143 Morningside Rd
- 154 Forest Ave
- 5 Whitman St
- 28 Oak Dr
- 62 Hillside Ave
- 4 Currey Ln
- 2 Currey Ln Unit 222
- 8 Currey Ln
- 15 Knutsen Dr
- 10 Currey Ln Unit 226
- 17 Knutsen Dr
- 12 Currey Ln Unit 227
- 14 Currey Ln
- 11 Knutsen Dr
- 9 Knutsen Dr Unit 193
- 7 Knutsen Dr Unit 192
- 19 Knutsen Dr Unit 219
- 19 Coggins Ln
- 21 Coggins Ln
- 12 Knutsen Dr Unit 199
- 21 Knutsen Dr Unit 218
- 16 Currey Ln
- 20 Currey Ln Unit 231
- 3 Knutsen Dr
- 10 Knutsen Dr