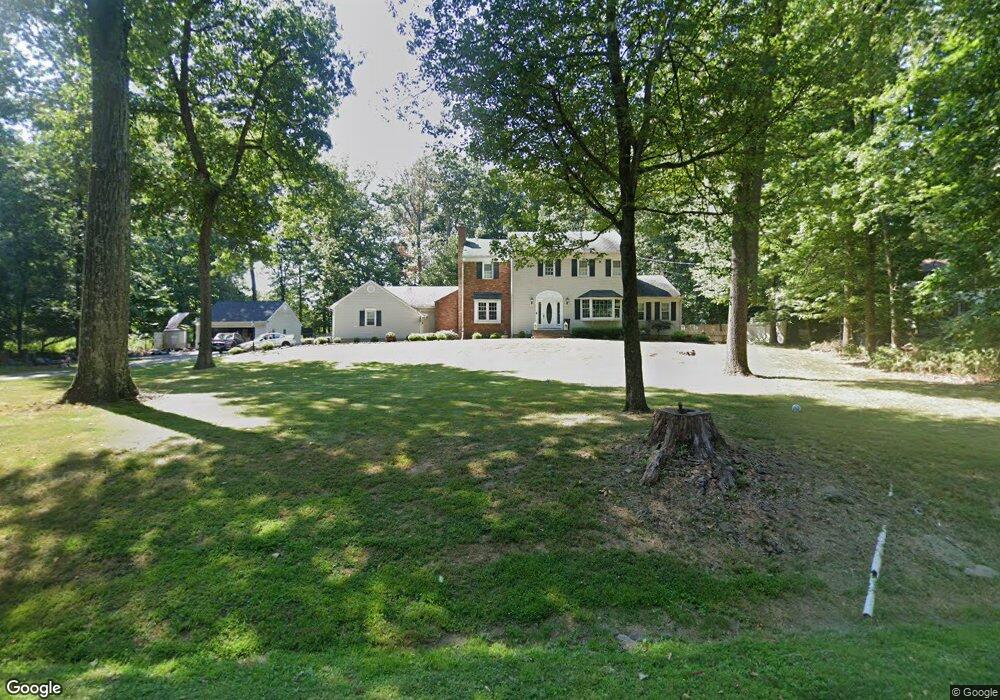
6 Curtis Dr Flemington, NJ 08822
Estimated Value: $739,000 - $796,061
--
Bed
--
Bath
3,238
Sq Ft
$236/Sq Ft
Est. Value
About This Home
This home is located at 6 Curtis Dr, Flemington, NJ 08822 and is currently estimated at $765,265, approximately $236 per square foot. 6 Curtis Dr is a home located in Hunterdon County with nearby schools including Robert Hunter Elementary School, Reading Fleming Intermediate School, and J.P. Case Middle School.
Ownership History
Date
Name
Owned For
Owner Type
Purchase Details
Closed on
Dec 27, 2024
Sold by
Buck Vicki L and Kanaby Robert F
Bought by
Papcun Ashley A and Papcun Joyce
Current Estimated Value
Home Financials for this Owner
Home Financials are based on the most recent Mortgage that was taken out on this home.
Original Mortgage
$462,962
Outstanding Balance
$459,728
Interest Rate
6.78%
Mortgage Type
FHA
Estimated Equity
$305,537
Purchase Details
Closed on
Aug 31, 2005
Sold by
Kanaby Robert F and Kanaby Lynn A
Bought by
Kanaby Robert F and Buck Vicki L
Home Financials for this Owner
Home Financials are based on the most recent Mortgage that was taken out on this home.
Original Mortgage
$370,000
Interest Rate
5.79%
Mortgage Type
New Conventional
Purchase Details
Closed on
Dec 13, 1994
Sold by
Kanaby Robert F and Kanaby Patricia
Bought by
Kanaby Robert F and Kanaby Lynn A
Create a Home Valuation Report for This Property
The Home Valuation Report is an in-depth analysis detailing your home's value as well as a comparison with similar homes in the area
Home Values in the Area
Average Home Value in this Area
Purchase History
| Date | Buyer | Sale Price | Title Company |
|---|---|---|---|
| Papcun Ashley A | $725,000 | Old Republic Title | |
| Papcun Ashley A | $725,000 | Old Republic Title | |
| Kanaby Robert F | -- | Commonwealth Land Title Insu | |
| Kanaby Robert F | $205,000 | -- |
Source: Public Records
Mortgage History
| Date | Status | Borrower | Loan Amount |
|---|---|---|---|
| Open | Papcun Ashley A | $462,962 | |
| Closed | Papcun Ashley A | $462,962 | |
| Previous Owner | Kanaby Robert F | $370,000 |
Source: Public Records
Tax History Compared to Growth
Tax History
| Year | Tax Paid | Tax Assessment Tax Assessment Total Assessment is a certain percentage of the fair market value that is determined by local assessors to be the total taxable value of land and additions on the property. | Land | Improvement |
|---|---|---|---|---|
| 2025 | $13,425 | $463,400 | $180,100 | $283,300 |
| 2024 | $12,623 | $463,400 | $180,100 | $283,300 |
| 2023 | $12,623 | $463,400 | $180,100 | $283,300 |
| 2022 | $12,303 | $463,400 | $180,100 | $283,300 |
| 2021 | $11,673 | $463,400 | $180,100 | $283,300 |
| 2020 | $11,914 | $463,400 | $180,100 | $283,300 |
| 2019 | $11,673 | $463,400 | $180,100 | $283,300 |
| 2018 | $11,529 | $463,400 | $180,100 | $283,300 |
| 2017 | $11,353 | $463,400 | $180,100 | $283,300 |
| 2016 | $11,149 | $463,400 | $180,100 | $283,300 |
| 2015 | $10,867 | $463,400 | $180,100 | $283,300 |
| 2014 | $10,723 | $463,400 | $180,100 | $283,300 |
Source: Public Records
Map
Nearby Homes
- 16 Stillwater Ln
- 41 Bonetown Rd
- 3 John Trout Rd
- 6 Carmen Ln
- 526 County Road 579
- 181 Old Croton Rd
- 5 Erin Place
- 33 Sergeantsville Rd
- 171 Old Croton Rd
- 15 Colts Ln
- 525 Sergeantsville Rd
- 100 State Route 12
- 0 Hardscrabble Hill Rd
- 198 Us-202
- 110 Copper Hill Rd
- 8 Reasoner Ln
- 402 Clark Cir
- 613 Village Commons
- 410 Village Commons
- 678 State Route 12