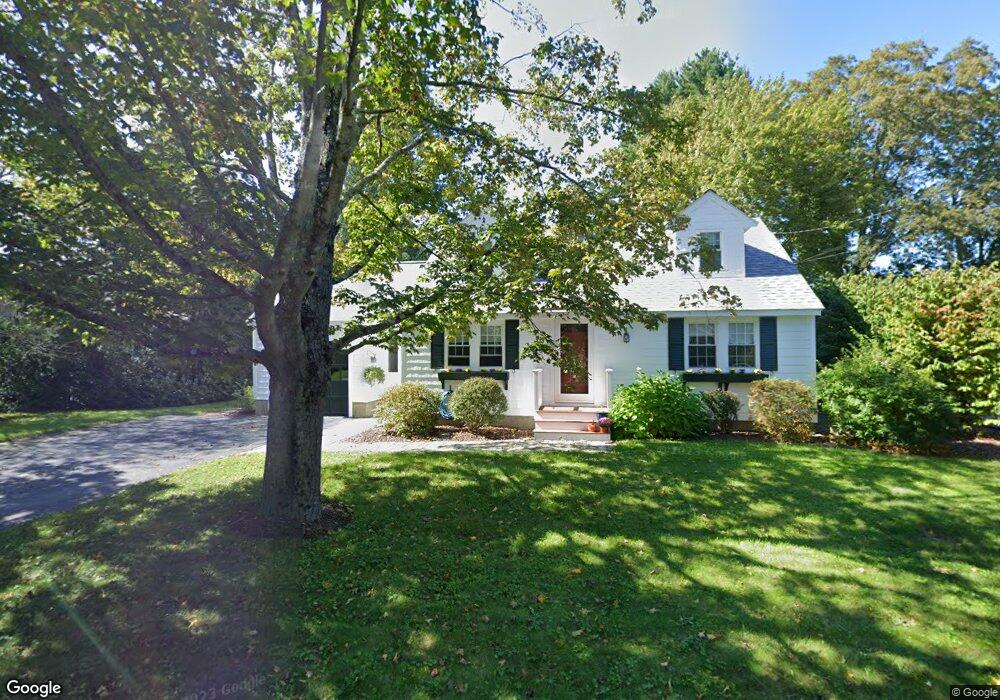
6 Curve St Medfield, MA 02052
Estimated Value: $724,553 - $819,000
2
Beds
2
Baths
1,337
Sq Ft
$564/Sq Ft
Est. Value
About This Home
This home is located at 6 Curve St, Medfield, MA 02052 and is currently estimated at $753,638, approximately $563 per square foot. 6 Curve St is a home located in Norfolk County with nearby schools including Ralph Wheelock School, Memorial School, and Dale Street School.
Ownership History
Date
Name
Owned For
Owner Type
Purchase Details
Closed on
May 1, 1992
Sold by
Green Mark H
Bought by
Delaney Robertc and Delaney Roberta H
Current Estimated Value
Purchase Details
Closed on
Mar 27, 1987
Sold by
Bartlett Michael J
Bought by
Green Mark H
Create a Home Valuation Report for This Property
The Home Valuation Report is an in-depth analysis detailing your home's value as well as a comparison with similar homes in the area
Home Values in the Area
Average Home Value in this Area
Purchase History
| Date | Buyer | Sale Price | Title Company |
|---|---|---|---|
| Delaney Robertc | $170,000 | -- | |
| Delaney Robertc | $170,000 | -- | |
| Green Mark H | $171,825 | -- |
Source: Public Records
Mortgage History
| Date | Status | Borrower | Loan Amount |
|---|---|---|---|
| Open | Green Mark H | $152,200 | |
| Closed | Green Mark H | $100,000 | |
| Closed | Green Mark H | $119,000 |
Source: Public Records
Tax History Compared to Growth
Tax History
| Year | Tax Paid | Tax Assessment Tax Assessment Total Assessment is a certain percentage of the fair market value that is determined by local assessors to be the total taxable value of land and additions on the property. | Land | Improvement |
|---|---|---|---|---|
| 2025 | $8,469 | $613,700 | $336,100 | $277,600 |
| 2024 | $8,277 | $565,400 | $311,600 | $253,800 |
| 2023 | $8,132 | $527,000 | $295,200 | $231,800 |
| 2022 | $7,842 | $450,200 | $278,800 | $171,400 |
| 2021 | $7,601 | $428,000 | $270,600 | $157,400 |
| 2020 | $7,430 | $416,700 | $264,000 | $152,700 |
| 2019 | $7,302 | $408,600 | $254,200 | $154,400 |
| 2018 | $6,519 | $382,800 | $237,800 | $145,000 |
| 2017 | $6,327 | $374,600 | $229,600 | $145,000 |
| 2016 | $6,246 | $372,900 | $227,900 | $145,000 |
| 2015 | $5,718 | $356,500 | $217,100 | $139,400 |
| 2014 | $5,439 | $337,400 | $198,000 | $139,400 |
Source: Public Records
Map
Nearby Homes