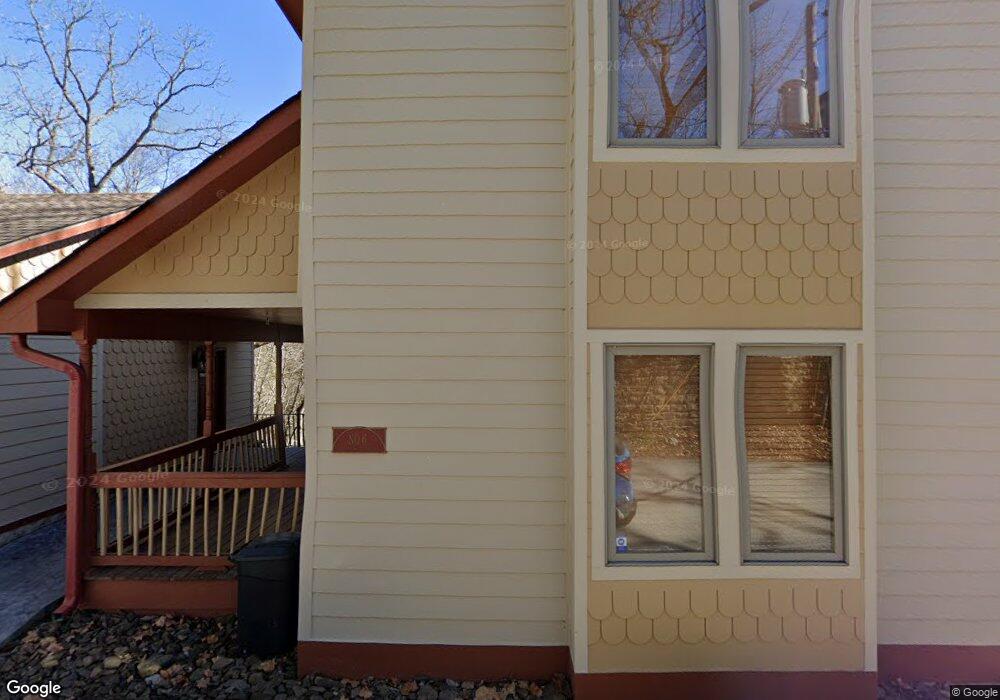
6 Cushing St Eureka Springs, AR 72632
Estimated Value: $371,000 - $813,000
4
Beds
4
Baths
2,452
Sq Ft
$242/Sq Ft
Est. Value
About This Home
This home is located at 6 Cushing St, Eureka Springs, AR 72632 and is currently estimated at $592,172, approximately $241 per square foot. 6 Cushing St is a home located in Carroll County with nearby schools including Eureka Springs Elementary School, Eureka Springs Middle School, and Eureka Springs High School.
Ownership History
Date
Name
Owned For
Owner Type
Purchase Details
Closed on
May 14, 2024
Sold by
Waits Land Company Llc
Bought by
Testamentary Trust and Waits
Current Estimated Value
Purchase Details
Closed on
Sep 30, 2008
Sold by
Not Provided
Bought by
Waits Land Company Llc
Purchase Details
Closed on
Nov 15, 2006
Sold by
Not Provided
Bought by
Laizure John and Laizure Bauer Bart/Mizelle
Purchase Details
Closed on
Nov 7, 2006
Sold by
Hse Eureka
Bought by
Laizure and Laizure Bauer
Purchase Details
Closed on
Feb 27, 2006
Sold by
Tst Mesa
Bought by
Eureka House Co
Purchase Details
Closed on
Oct 2, 2001
Sold by
Vangeffen
Bought by
Mesa Trust
Purchase Details
Closed on
Aug 24, 2001
Sold by
Victory Tst
Bought by
Victory Ea
Purchase Details
Closed on
Mar 12, 1992
Sold by
Victory
Bought by
Victory
Create a Home Valuation Report for This Property
The Home Valuation Report is an in-depth analysis detailing your home's value as well as a comparison with similar homes in the area
Purchase History
| Date | Buyer | Sale Price | Title Company |
|---|---|---|---|
| Testamentary Trust | -- | None Listed On Document | |
| Waits Land Company Llc | $365,000 | -- | |
| Laizure John | -- | -- | |
| Laizure John | $365,000 | -- | |
| Laizure John | -- | -- | |
| Waits Land Co Llc | -- | None Available | |
| Laizure John | -- | -- | |
| Laizure | -- | -- | |
| Eureka House Co | $189,000 | -- | |
| Mesa Trust | $18,000 | -- | |
| Victory Ea | -- | -- | |
| Victory | -- | -- |
Source: Public Records
Tax History
| Year | Tax Paid | Tax Assessment Tax Assessment Total Assessment is a certain percentage of the fair market value that is determined by local assessors to be the total taxable value of land and additions on the property. | Land | Improvement |
|---|---|---|---|---|
| 2025 | $4,466 | $120,180 | $6,300 | $113,880 |
| 2024 | $4,060 | $92,090 | $5,400 | $86,690 |
| 2023 | $3,748 | $92,090 | $5,400 | $86,690 |
| 2022 | $3,435 | $92,090 | $5,400 | $86,690 |
| 2021 | $3,125 | $61,840 | $4,500 | $57,340 |
| 2020 | $3,066 | $60,680 | $4,500 | $56,180 |
| 2019 | $2,857 | $56,190 | $4,500 | $51,690 |
| 2018 | $2,857 | $56,190 | $4,500 | $51,690 |
| 2017 | $2,726 | $56,190 | $4,500 | $51,690 |
| 2016 | $2,462 | $48,720 | $3,600 | $45,120 |
| 2014 | -- | $48,720 | $3,600 | $45,120 |
Source: Public Records
Map
Nearby Homes
- 157 N Main St
- TBD N Main
- 5 Alexander St
- 215 Spring St
- 60 Crescent Dr
- 0 Fairmont
- 179 N Main St
- 63 N Main St
- 50 N Main St
- 1 Ridgeway Ave
- 23 Hillside Ave
- 8 Linwood Ave
- 3 Prospect Ave
- 46 Hillside Ave
- 17 Berryville Ave
- 103 Washington St
- 273 N Main St
- 0 Carroll Ave Unit 1304115
- 5 Washington St
- 320 Spring St
Your Personal Tour Guide
Ask me questions while you tour the home.