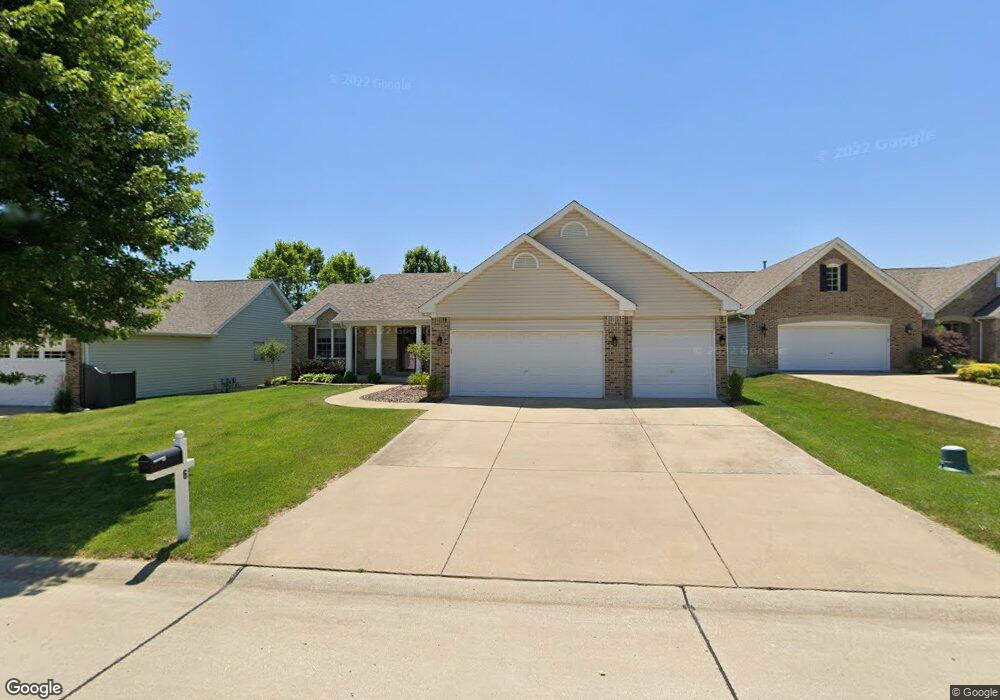
6 Dandridge Ct Saint Peters, MO 63376
Estimated Value: $388,000 - $408,000
3
Beds
2
Baths
1,842
Sq Ft
$216/Sq Ft
Est. Value
About This Home
This home is located at 6 Dandridge Ct, Saint Peters, MO 63376 and is currently estimated at $397,219, approximately $215 per square foot. 6 Dandridge Ct is a home located in St. Charles County with nearby schools including Lewis & Clark Elementary School, Fort Zumwalt South Middle School, and Fort Zumwalt South High School.
Ownership History
Date
Name
Owned For
Owner Type
Purchase Details
Closed on
Feb 15, 2008
Sold by
Daven Patrick S and Daven Renee M
Bought by
Daven Renee M
Current Estimated Value
Home Financials for this Owner
Home Financials are based on the most recent Mortgage that was taken out on this home.
Original Mortgage
$180,000
Outstanding Balance
$112,465
Interest Rate
5.88%
Mortgage Type
New Conventional
Estimated Equity
$284,754
Purchase Details
Closed on
Aug 13, 2001
Sold by
Tr Hughes Inc
Bought by
Daven Patrick S and Daven Renee M
Home Financials for this Owner
Home Financials are based on the most recent Mortgage that was taken out on this home.
Original Mortgage
$148,800
Interest Rate
7.14%
Purchase Details
Closed on
May 14, 2001
Sold by
Summit Pointe Lc
Bought by
Tr Hughes Inc
Home Financials for this Owner
Home Financials are based on the most recent Mortgage that was taken out on this home.
Original Mortgage
$147,700
Interest Rate
6.99%
Mortgage Type
Construction
Create a Home Valuation Report for This Property
The Home Valuation Report is an in-depth analysis detailing your home's value as well as a comparison with similar homes in the area
Home Values in the Area
Average Home Value in this Area
Purchase History
| Date | Buyer | Sale Price | Title Company |
|---|---|---|---|
| Daven Renee M | -- | Lacw | |
| Daven Patrick S | -- | -- | |
| Tr Hughes Inc | -- | -- |
Source: Public Records
Mortgage History
| Date | Status | Borrower | Loan Amount |
|---|---|---|---|
| Open | Daven Renee M | $180,000 | |
| Closed | Daven Patrick S | $148,800 | |
| Previous Owner | Tr Hughes Inc | $147,700 |
Source: Public Records
Tax History Compared to Growth
Tax History
| Year | Tax Paid | Tax Assessment Tax Assessment Total Assessment is a certain percentage of the fair market value that is determined by local assessors to be the total taxable value of land and additions on the property. | Land | Improvement |
|---|---|---|---|---|
| 2025 | $4,086 | $64,493 | -- | -- |
| 2023 | $4,083 | $57,345 | $0 | $0 |
| 2022 | $3,764 | $49,527 | $0 | $0 |
| 2021 | $3,758 | $49,527 | $0 | $0 |
| 2020 | $3,734 | $47,711 | $0 | $0 |
| 2019 | $3,725 | $47,711 | $0 | $0 |
| 2018 | $3,690 | $45,431 | $0 | $0 |
| 2017 | $3,673 | $45,431 | $0 | $0 |
| 2016 | $3,358 | $41,434 | $0 | $0 |
| 2015 | $3,144 | $41,434 | $0 | $0 |
| 2014 | $2,759 | $35,595 | $0 | $0 |
Source: Public Records
Map
Nearby Homes
- 9 Southwinds Dr
- 22 Westwinds Dr
- 531 Summer Winds Ln
- 97 Four Winds Dr
- 1433 Schoal Creek Dr
- 117 Blue Water Dr
- 154 Blue Water Dr
- 4 Inverness Ct
- 613 Otter Creek Trail
- 9 Tori Ann Dr
- 212 Natural Spring Dr
- 164 Blue Water Dr
- 59 Gateswood Dr
- 175 Blue Water Dr
- 54 Deer Grove Dr
- 1005 Belleau Creek Rd
- Fairground - Interior Townhome Plan at Birdie Hill Crossing - Townhome Collection
- Fairground - Exterior Townhome Plan at Birdie Hill Crossing - Townhome Collection
- Dover Plan at Birdie Hill Crossing - Cottage Collection
- Windsor Plan at Birdie Hill Crossing - Cottage Collection
- 8 Dandridge Ct
- 4 Dandridge Ct
- 3 Swift Creek Ct
- 2 Dandridge Ct
- 5 Dandridge Ct
- 10 Dandridge Ct
- 7 Dandridge Ct
- 3 Dandridge Ct
- 83 Boschert Creek Dr
- 5 Swift Creek Ct
- 1 Swift Creek Ct
- 1 Dandridge Ct
- 12 Dandridge Ct
- 85 Boschert Creek Dr
- 11 Dandridge Ct
- 7 Swift Creek Ct
- 71 Boschert Creek Dr
- 63 Boschert Creek Dr
- 80 Boschert Creek Dr
- 78 Boschert Creek Dr