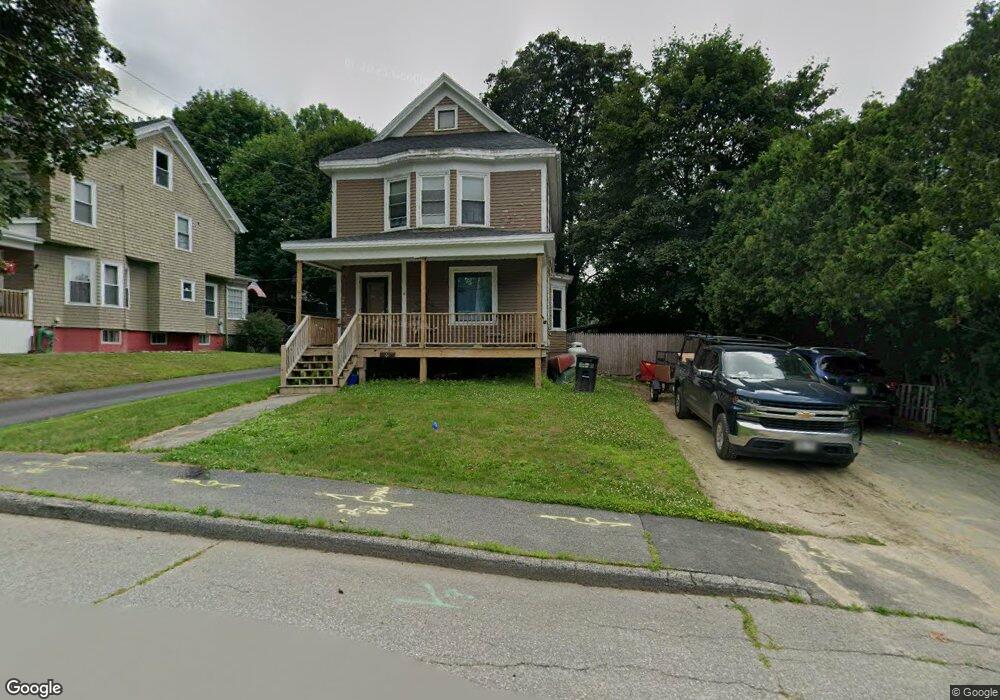
6 Davenport St Augusta, ME 04330
Estimated Value: $248,959 - $264,000
3
Beds
1
Bath
1,688
Sq Ft
$151/Sq Ft
Est. Value
About This Home
This home is located at 6 Davenport St, Augusta, ME 04330 and is currently estimated at $255,490, approximately $151 per square foot. 6 Davenport St is a home located in Kennebec County with nearby schools including Cony Middle School, Cony School, and Maine Virtual Academy.
Ownership History
Date
Name
Owned For
Owner Type
Purchase Details
Closed on
Jul 9, 2007
Sold by
Gurney Bonnie M and Gurney Robert R
Bought by
Hafey Patrick J
Current Estimated Value
Home Financials for this Owner
Home Financials are based on the most recent Mortgage that was taken out on this home.
Original Mortgage
$132,050
Outstanding Balance
$81,282
Interest Rate
6.39%
Mortgage Type
Purchase Money Mortgage
Estimated Equity
$174,208
Create a Home Valuation Report for This Property
The Home Valuation Report is an in-depth analysis detailing your home's value as well as a comparison with similar homes in the area
Home Values in the Area
Average Home Value in this Area
Purchase History
| Date | Buyer | Sale Price | Title Company |
|---|---|---|---|
| Hafey Patrick J | -- | -- | |
| Hafey Patrick J | -- | -- | |
| Hafey Patrick J | -- | -- |
Source: Public Records
Mortgage History
| Date | Status | Borrower | Loan Amount |
|---|---|---|---|
| Open | Hafey Patrick J | $132,050 | |
| Closed | Hafey Patrick J | $132,050 |
Source: Public Records
Tax History
| Year | Tax Paid | Tax Assessment Tax Assessment Total Assessment is a certain percentage of the fair market value that is determined by local assessors to be the total taxable value of land and additions on the property. | Land | Improvement |
|---|---|---|---|---|
| 2024 | $2,328 | $97,800 | $28,300 | $69,500 |
| 2023 | $2,245 | $97,800 | $28,300 | $69,500 |
| 2022 | $2,144 | $97,800 | $28,300 | $69,500 |
| 2021 | $2,048 | $97,800 | $28,300 | $69,500 |
| 2020 | $2,048 | $97,800 | $28,300 | $69,500 |
| 2019 | $2,051 | $97,800 | $28,300 | $69,500 |
| 2018 | $2,051 | $97,800 | $28,300 | $69,500 |
| 2017 | $1,993 | $97,800 | $28,300 | $69,500 |
| 2016 | $1,935 | $97,800 | $28,300 | $69,500 |
| 2015 | $1,703 | $97,800 | $28,300 | $69,500 |
| 2014 | $1,826 | $97,800 | $28,300 | $69,500 |
Source: Public Records
Map
Nearby Homes