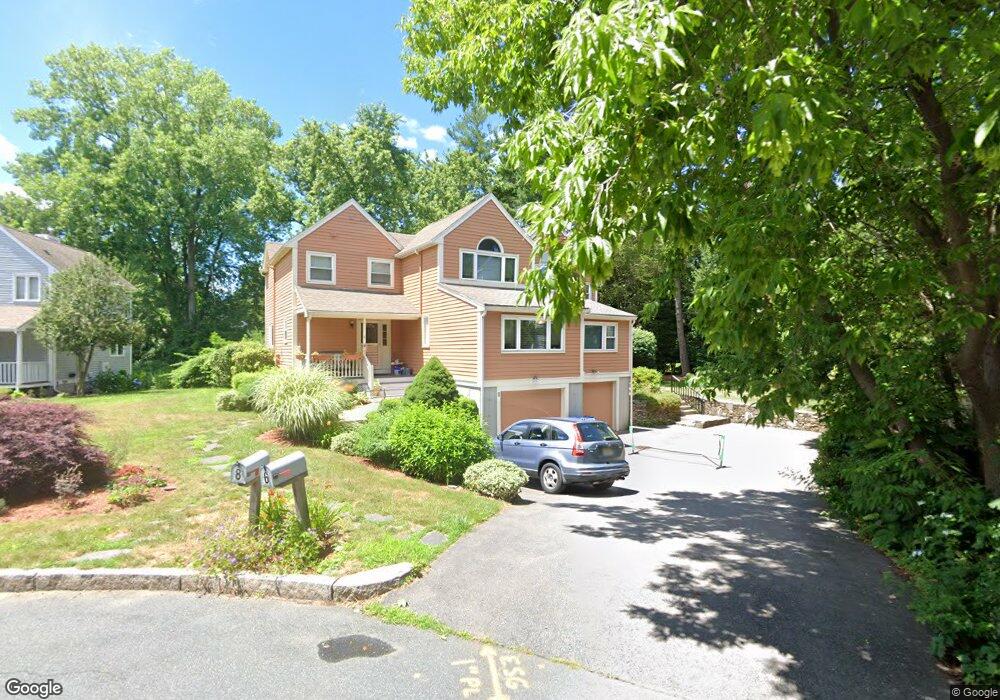
6 David Dr Unit 2 Natick, MA 01760
Estimated Value: $773,912 - $840,000
3
Beds
2
Baths
1,805
Sq Ft
$445/Sq Ft
Est. Value
About This Home
This home is located at 6 David Dr Unit 2, Natick, MA 01760 and is currently estimated at $803,228, approximately $445 per square foot. 6 David Dr Unit 2 is a home located in Middlesex County with nearby schools including Natick High School, Lilja Elementary School, and Wilson Middle School.
Ownership History
Date
Name
Owned For
Owner Type
Purchase Details
Closed on
Mar 15, 2019
Sold by
Roberts Nt
Bought by
Vallas Laurie and Brambilla Lisa
Current Estimated Value
Purchase Details
Closed on
Mar 26, 2012
Sold by
Roberts Nt and Roberts Mary E
Bought by
Roberts Mary E
Home Financials for this Owner
Home Financials are based on the most recent Mortgage that was taken out on this home.
Original Mortgage
$255,500
Interest Rate
3.86%
Mortgage Type
New Conventional
Purchase Details
Closed on
Dec 30, 2009
Sold by
Roberts Tr Mary Elizabeth
Bought by
Roberts Nt and Roberts Mary Elizabeth
Purchase Details
Closed on
Jun 2, 1997
Sold by
Kennedy Gail F
Bought by
Shpektor Yury and Shpektor Inna
Create a Home Valuation Report for This Property
The Home Valuation Report is an in-depth analysis detailing your home's value as well as a comparison with similar homes in the area
Home Values in the Area
Average Home Value in this Area
Purchase History
| Date | Buyer | Sale Price | Title Company |
|---|---|---|---|
| Vallas Laurie | -- | -- | |
| Roberts Mary E | -- | -- | |
| Roberts Nt | -- | -- | |
| Shpektor Yury | $202,000 | -- |
Source: Public Records
Mortgage History
| Date | Status | Borrower | Loan Amount |
|---|---|---|---|
| Previous Owner | Roberts Mary E | $255,500 | |
| Previous Owner | Shpektor Yury | $261,500 | |
| Previous Owner | Shpektor Yury | $241,000 | |
| Previous Owner | Shpektor Yury | $227,000 | |
| Previous Owner | Shpektor Yury | $163,000 |
Source: Public Records
Tax History Compared to Growth
Tax History
| Year | Tax Paid | Tax Assessment Tax Assessment Total Assessment is a certain percentage of the fair market value that is determined by local assessors to be the total taxable value of land and additions on the property. | Land | Improvement |
|---|---|---|---|---|
| 2025 | $8,659 | $724,000 | $0 | $724,000 |
| 2024 | $8,038 | $655,600 | $0 | $655,600 |
| 2023 | $7,707 | $609,700 | $0 | $609,700 |
| 2022 | $7,352 | $551,100 | $0 | $551,100 |
| 2021 | $7,118 | $523,000 | $0 | $523,000 |
| 2020 | $6,896 | $506,700 | $0 | $506,700 |
| 2019 | $6,440 | $506,700 | $0 | $506,700 |
| 2018 | $6,319 | $484,200 | $0 | $484,200 |
| 2017 | $6,311 | $467,800 | $0 | $467,800 |
| 2016 | $6,212 | $457,800 | $0 | $457,800 |
| 2015 | $5,865 | $424,400 | $0 | $424,400 |
Source: Public Records
Map
Nearby Homes
- 20 Florence St Unit B
- 16 Harvard St
- 4 Willow St
- 26 Walnut St
- 2 Yuba Place
- 34 N Main St Unit 2
- 3 Vale St Unit B
- 58 N Main St Unit 304
- 3 Wilson St Unit 3B
- 62 E Central St Unit 305
- 4B Lincoln St Unit 4B
- 5 Wilson St Unit 5A
- 6B Lincoln St Unit 6B
- 49 Summer St
- 67 E Central St & 5 Union St
- 20 Marion St
- 15 Church St Unit 3
- 48 S Main St Unit 7
- 31 Marion St
- 11 Avon St