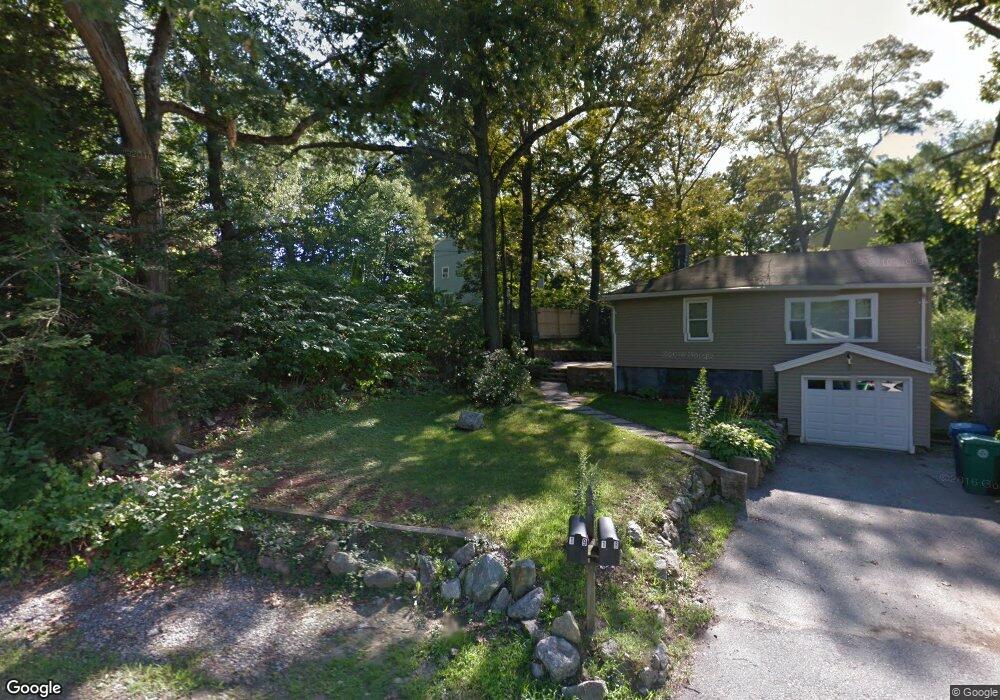
6 Day St Billerica, MA 01821
Estimated Value: $544,808 - $760,000
3
Beds
2
Baths
1,632
Sq Ft
$405/Sq Ft
Est. Value
About This Home
This home is located at 6 Day St, Billerica, MA 01821 and is currently estimated at $660,202, approximately $404 per square foot. 6 Day St is a home located in Middlesex County with nearby schools including Billerica Memorial High School.
Ownership History
Date
Name
Owned For
Owner Type
Purchase Details
Closed on
Nov 21, 2019
Sold by
Melendez Jonathan and Melendez Laura
Bought by
Buccieri Laura M
Current Estimated Value
Home Financials for this Owner
Home Financials are based on the most recent Mortgage that was taken out on this home.
Original Mortgage
$215,000
Outstanding Balance
$189,706
Interest Rate
3.75%
Mortgage Type
New Conventional
Estimated Equity
$470,496
Purchase Details
Closed on
Jun 21, 2010
Sold by
Goodwin Herman T and Goodwin Karen M
Bought by
Melendez Jonathan and Melendez Laura
Home Financials for this Owner
Home Financials are based on the most recent Mortgage that was taken out on this home.
Original Mortgage
$250,267
Interest Rate
5.03%
Mortgage Type
Purchase Money Mortgage
Create a Home Valuation Report for This Property
The Home Valuation Report is an in-depth analysis detailing your home's value as well as a comparison with similar homes in the area
Home Values in the Area
Average Home Value in this Area
Purchase History
| Date | Buyer | Sale Price | Title Company |
|---|---|---|---|
| Buccieri Laura M | -- | -- | |
| Melendez Jonathan | $245,000 | -- |
Source: Public Records
Mortgage History
| Date | Status | Borrower | Loan Amount |
|---|---|---|---|
| Open | Buccieri Laura M | $215,000 | |
| Previous Owner | Melendez Jonathan | $250,267 |
Source: Public Records
Tax History Compared to Growth
Tax History
| Year | Tax Paid | Tax Assessment Tax Assessment Total Assessment is a certain percentage of the fair market value that is determined by local assessors to be the total taxable value of land and additions on the property. | Land | Improvement |
|---|---|---|---|---|
| 2025 | $5,028 | $442,200 | $255,500 | $186,700 |
| 2024 | $4,754 | $421,100 | $239,300 | $181,800 |
| 2023 | $4,837 | $407,500 | $214,400 | $193,100 |
| 2022 | $4,358 | $344,800 | $186,400 | $158,400 |
| 2021 | $4,225 | $325,000 | $169,000 | $156,000 |
| 2020 | $4,068 | $313,200 | $162,300 | $150,900 |
| 2019 | $3,952 | $293,200 | $159,300 | $133,900 |
| 2018 | $3,780 | $266,400 | $139,500 | $126,900 |
| 2017 | $3,642 | $258,500 | $138,300 | $120,200 |
| 2016 | $3,507 | $248,000 | $127,800 | $120,200 |
| 2015 | $3,482 | $248,000 | $127,800 | $120,200 |
| 2014 | $3,411 | $238,700 | $118,500 | $120,200 |
Source: Public Records
Map
Nearby Homes