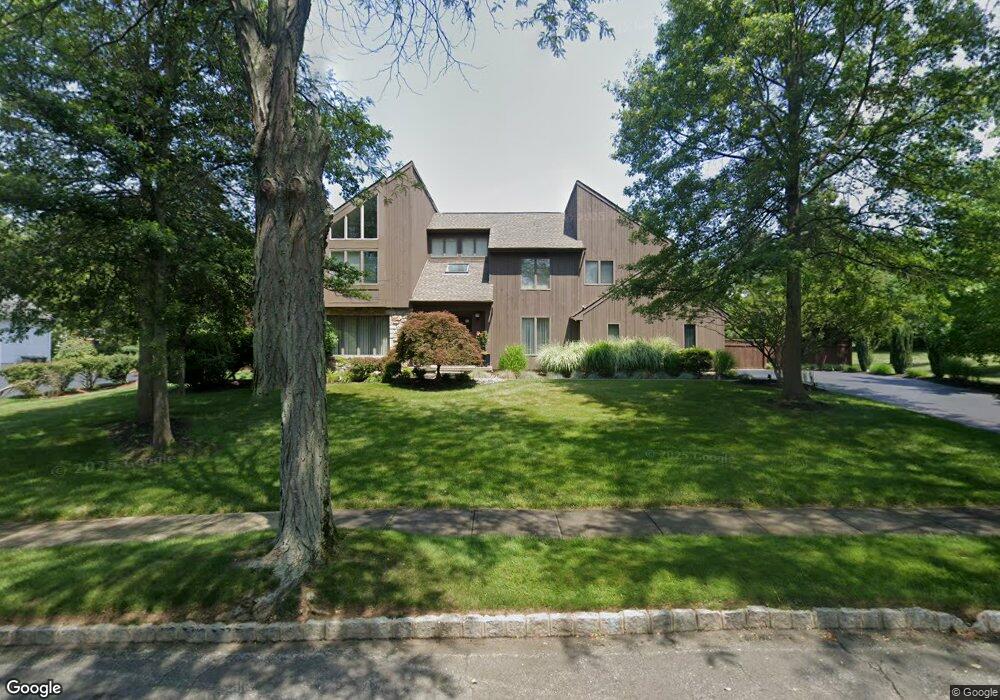
6 Dean Ct Princeton Junction, NJ 08550
Estimated Value: $1,214,974 - $1,458,000
Studio
--
Bath
3,821
Sq Ft
$360/Sq Ft
Est. Value
About This Home
This home is located at 6 Dean Ct, Princeton Junction, NJ 08550 and is currently estimated at $1,375,494, approximately $359 per square foot. 6 Dean Ct is a home located in Mercer County with nearby schools including Maurice Hawk Elementary School, Millstone River School, and Community Middle School.
Ownership History
Date
Name
Owned For
Owner Type
Purchase Details
Closed on
Oct 27, 1996
Sold by
Forusz Samuel
Bought by
Kotsinonos Leo and Russ Elizabeth
Current Estimated Value
Home Financials for this Owner
Home Financials are based on the most recent Mortgage that was taken out on this home.
Original Mortgage
$391,000
Outstanding Balance
$38,193
Interest Rate
7.99%
Mortgage Type
Purchase Money Mortgage
Estimated Equity
$1,337,301
Purchase Details
Closed on
Sep 28, 1990
Sold by
Trafalgar House Property Inc
Bought by
Forusz Samuel L and Forusz Judith E
Create a Home Valuation Report for This Property
The Home Valuation Report is an in-depth analysis detailing your home's value as well as a comparison with similar homes in the area
Home Values in the Area
Average Home Value in this Area
Purchase History
| Date | Buyer | Sale Price | Title Company |
|---|---|---|---|
| Kotsinonos Leo | $390,000 | -- | |
| Forusz Samuel L | $431,000 | -- |
Source: Public Records
Mortgage History
| Date | Status | Borrower | Loan Amount |
|---|---|---|---|
| Open | Kotsinonos Leo | $391,000 |
Source: Public Records
Tax History
| Year | Tax Paid | Tax Assessment Tax Assessment Total Assessment is a certain percentage of the fair market value that is determined by local assessors to be the total taxable value of land and additions on the property. | Land | Improvement |
|---|---|---|---|---|
| 2025 | $21,807 | $711,500 | $263,200 | $448,300 |
| 2024 | $20,897 | $711,500 | $263,200 | $448,300 |
| 2023 | $20,897 | $711,500 | $263,200 | $448,300 |
| 2022 | $20,491 | $711,500 | $263,200 | $448,300 |
| 2021 | $20,320 | $711,500 | $263,200 | $448,300 |
| 2020 | $19,950 | $711,500 | $263,200 | $448,300 |
| 2019 | $19,723 | $711,500 | $263,200 | $448,300 |
| 2018 | $19,538 | $711,500 | $263,200 | $448,300 |
| 2017 | $19,132 | $711,500 | $263,200 | $448,300 |
| 2016 | $18,720 | $711,500 | $263,200 | $448,300 |
| 2015 | $18,286 | $711,500 | $263,200 | $448,300 |
| 2014 | $18,072 | $711,500 | $263,200 | $448,300 |
Source: Public Records
Map
Nearby Homes
Your Personal Tour Guide
Ask me questions while you tour the home.