Estimated Value: $153,000 - $203,000
2
Beds
2
Baths
1,404
Sq Ft
$126/Sq Ft
Est. Value
About This Home
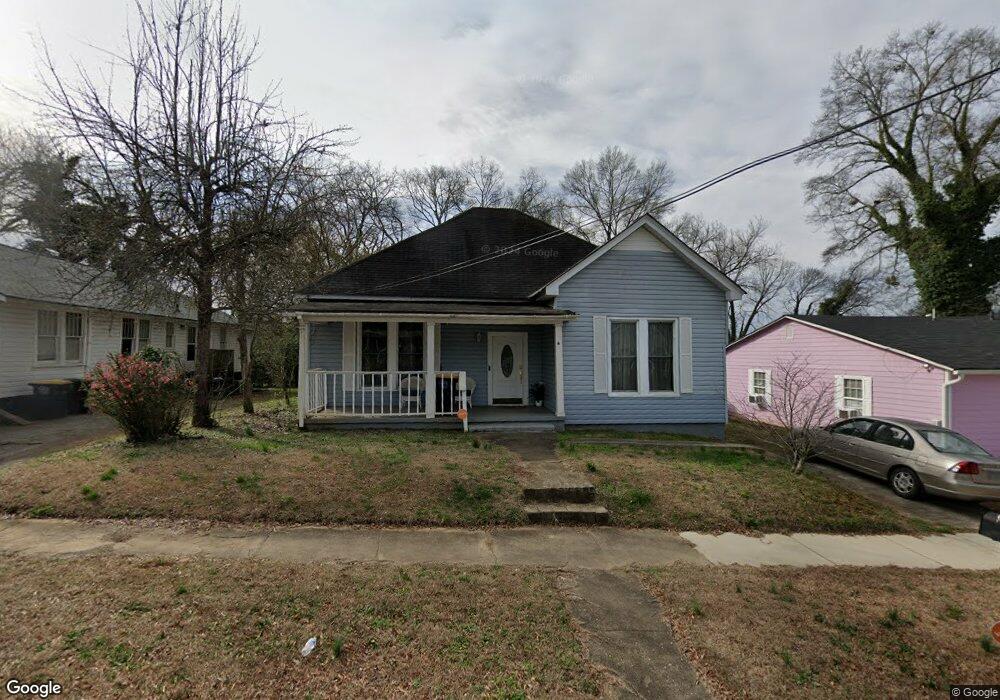
This home is located at 6 E 10th St SW Unit SW, Rome, GA 30161 and is currently estimated at $176,753, approximately $125 per square foot. 6 E 10th St SW Unit SW is a home located in Floyd County with nearby schools including Dan McCarty Middle School, Rome High School, and St. Mary School.
Ownership History
Date
Name
Owned For
Owner Type
Purchase Details
Closed on
Jun 6, 2023
Sold by
Ware Sharon
Bought by
Smith Emmanuel
Current Estimated Value
Home Financials for this Owner
Home Financials are based on the most recent Mortgage that was taken out on this home.
Original Mortgage
$134,830
Outstanding Balance
$131,198
Interest Rate
6.35%
Mortgage Type
New Conventional
Estimated Equity
$45,555
Purchase Details
Closed on
Nov 18, 2022
Sold by
Wallace Gene
Bought by
Ware Sharon
Purchase Details
Closed on
Aug 1, 2017
Sold by
Harris Jimmy Thomas
Bought by
Brown Sharon Huston
Purchase Details
Closed on
Oct 10, 1994
Sold by
Barnes Samuel L
Bought by
Harris Jimmy Thomas
Purchase Details
Closed on
Nov 10, 1981
Bought by
P and R
Purchase Details
Closed on
Sep 27, 1971
Sold by
Brown-Elizabeth
Bought by
Barnes Samuel L
Purchase Details
Closed on
Jun 29, 1964
Sold by
Holler W H
Bought by
Brown-Elizabeth
Purchase Details
Closed on
Jan 1, 1901
Bought by
Holler W H
Create a Home Valuation Report for This Property
The Home Valuation Report is an in-depth analysis detailing your home's value as well as a comparison with similar homes in the area
Home Values in the Area
Average Home Value in this Area
Purchase History
| Date | Buyer | Sale Price | Title Company |
|---|---|---|---|
| Smith Emmanuel | $139,000 | -- | |
| Ware Sharon | -- | -- | |
| Brown Sharon Huston | $12,100 | -- | |
| Harris Jimmy Thomas | $29,500 | -- | |
| P | -- | -- | |
| Barnes Samuel L | $6,400 | -- | |
| Brown-Elizabeth | -- | -- | |
| Holler W H | -- | -- |
Source: Public Records
Mortgage History
| Date | Status | Borrower | Loan Amount |
|---|---|---|---|
| Open | Smith Emmanuel | $134,830 |
Source: Public Records
Tax History Compared to Growth
Tax History
| Year | Tax Paid | Tax Assessment Tax Assessment Total Assessment is a certain percentage of the fair market value that is determined by local assessors to be the total taxable value of land and additions on the property. | Land | Improvement |
|---|---|---|---|---|
| 2024 | $1,554 | $63,535 | $4,404 | $59,131 |
| 2023 | $1,716 | $48,863 | $3,987 | $44,876 |
| 2022 | $1,443 | $39,551 | $3,190 | $36,361 |
| 2021 | $1,308 | $35,262 | $3,190 | $32,072 |
| 2020 | $1,215 | $32,483 | $2,492 | $29,991 |
| 2019 | $1,123 | $30,338 | $2,492 | $27,846 |
| 2018 | $1,045 | $28,225 | $2,492 | $25,733 |
| 2017 | $997 | $26,932 | $2,492 | $24,440 |
| 2016 | $970 | $26,133 | $2,480 | $23,653 |
| 2015 | $916 | $26,133 | $2,480 | $23,653 |
| 2014 | $916 | $26,133 | $2,480 | $23,653 |
Source: Public Records
Map
Nearby Homes
- 166 E 11th St SW
- 2 E 10th St SW
- 164 E 11th St SE
- 168 E 11th St SE
- 162 E 11th St SE
- 170 E 11th St SW
- 31 Notasulga Dr SW
- 9 Eastridge Ct SW
- 801 Maple Ave SW
- 2 Fair St SW
- 106 E 14th St SW
- 4 E 15th St SW
- 2 Coral Ave SW
- 1502 Spring Creek St SW
- 702 River Ave SW
- 39 E 16th St SW
- 316 S McLin St SW
- 000 E Oglethorpe Hwy
- 211 E 11th St SE
- 6 E 10th St SW
- 4 E 10th St SW
- 8 E 10th St SW Unit 10
- 8 E 10th St SW
- 103 E 11th St SW
- 12 E 10th St SW
- 1 E 11th St SW
- 1003 Walnut Ave SW
- 105 E 11th St SW Unit 2
- 105 E 11th St SW
- 105 E 11th St SW Unit 4
- 105 E 11th St SW Unit 5
- 105 E 11th St SW Unit 6
- 105 E 11th St SW Unit 3
- 1005 Walnut Ave SW
- 5 E 10th St SW
- 1007 Walnut Ave SW
- 3 E 10th St SW
- 1001 Walnut Ave SW
- 7 E 10th St SW