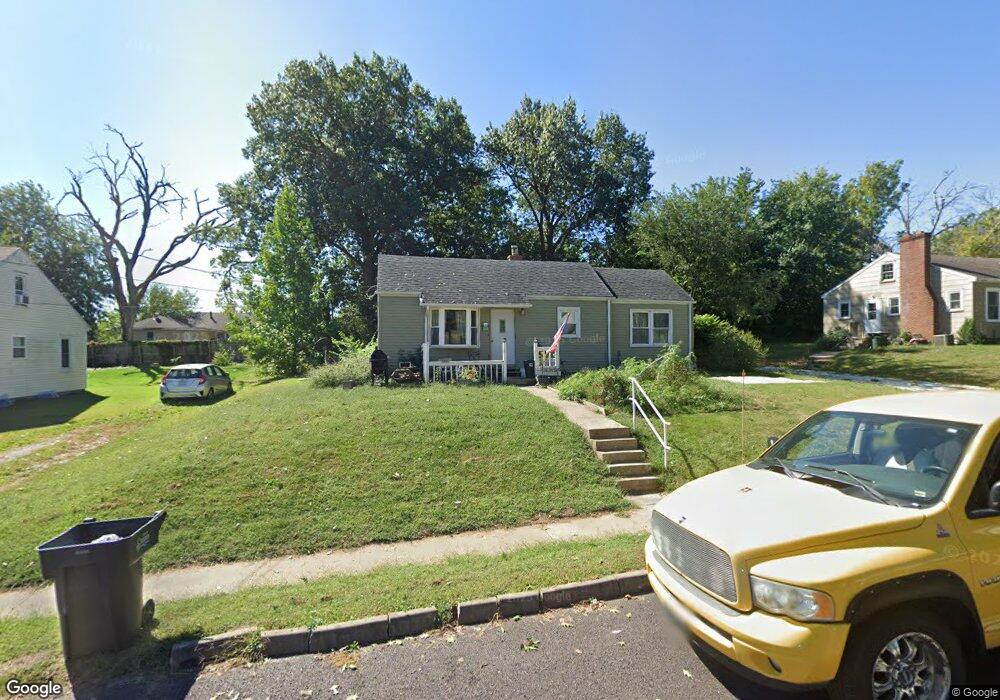
6 E Oliver St Fulton, MO 65251
Estimated Value: $137,338 - $155,000
Studio
--
Bath
1,028
Sq Ft
$145/Sq Ft
Est. Value
About This Home
This home is located at 6 E Oliver St, Fulton, MO 65251 and is currently estimated at $149,335, approximately $145 per square foot. 6 E Oliver St is a home located in Callaway County with nearby schools including Fulton Senior High School, Kingdom Christian Academy, and St. Peter Catholic School.
Ownership History
Date
Name
Owned For
Owner Type
Purchase Details
Closed on
Feb 3, 2024
Sold by
Dillingham Jeffrey A
Bought by
Downey Kathrine M
Current Estimated Value
Purchase Details
Closed on
Dec 28, 2007
Sold by
Bacon Dennis Dean and Bacon Angela M
Bought by
Ousley Catherine
Home Financials for this Owner
Home Financials are based on the most recent Mortgage that was taken out on this home.
Original Mortgage
$77,900
Interest Rate
6.26%
Mortgage Type
New Conventional
Purchase Details
Closed on
Sep 14, 2006
Sold by
Morris Martha Jane
Bought by
Dillingham Jeffrey and Dillingham Kathrine
Home Financials for this Owner
Home Financials are based on the most recent Mortgage that was taken out on this home.
Original Mortgage
$49,800
Interest Rate
6.55%
Mortgage Type
New Conventional
Create a Home Valuation Report for This Property
The Home Valuation Report is an in-depth analysis detailing your home's value as well as a comparison with similar homes in the area
Home Values in the Area
Average Home Value in this Area
Purchase History
| Date | Buyer | Sale Price | Title Company |
|---|---|---|---|
| Downey Kathrine M | -- | None Listed On Document | |
| Ousley Catherine | -- | None Available | |
| Dillingham Jeffrey | -- | None Available |
Source: Public Records
Mortgage History
| Date | Status | Borrower | Loan Amount |
|---|---|---|---|
| Previous Owner | Ousley Catherine | $77,900 | |
| Previous Owner | Dillingham Jeffrey | $49,800 |
Source: Public Records
Tax History
| Year | Tax Paid | Tax Assessment Tax Assessment Total Assessment is a certain percentage of the fair market value that is determined by local assessors to be the total taxable value of land and additions on the property. | Land | Improvement |
|---|---|---|---|---|
| 2025 | $894 | $14,473 | $0 | $0 |
| 2024 | $894 | $14,473 | $0 | $0 |
| 2023 | $895 | $13,998 | $0 | $0 |
| 2022 | $862 | $13,998 | $2,060 | $11,938 |
| 2021 | $861 | $13,998 | $2,060 | $11,938 |
| 2020 | $873 | $13,998 | $2,060 | $11,938 |
| 2019 | $844 | $13,998 | $2,060 | $11,938 |
| 2018 | $677 | $10,857 | $2,060 | $8,797 |
| 2017 | $602 | $10,857 | $2,060 | $8,797 |
| 2016 | $529 | $9,140 | $0 | $0 |
| 2015 | $517 | $9,140 | $0 | $0 |
| 2014 | -- | $9,840 | $0 | $0 |
Source: Public Records
Map
Nearby Homes
- 106 Schultze St
- 509 S Business 54
- 202 W Chestnut St
- 1235 Addalyn Dr
- 207 Blackburn St
- 221 W 6th St
- 213 E 6th St
- 210 King St
- 610 Grand Ave
- 801 Court St
- 601 Cote Sans Dessein Rd
- 0
- 0 Greenwood Hills Lot#18
- 3.69 ACRES Tennyson Rd
- 820 Nichols St
- 1396 Jessica Ln
- 730 Vine St
- 734 Vine St
- 586 Gregory Ln
- 839 Green St
- 8 E Oliver St
- 4 E Oliver St
- 7 E Chestnut St
- 9 E Chestnut St
- 5 E Chestnut St
- 10 E Oliver St
- 7 E Oliver St
- 9 E Oliver St
- 5 E Oliver St
- 3 E Chestnut St
- 11 E Chestnut St
- 2 E Oliver St
- 12 E Oliver St
- 11 E Oliver St
- 1 E Oliver St
- 13 E Oliver St
- 8 E Chestnut St
- 6 E Chestnut St
- 2 Washington St
- 6 Schultze St
Your Personal Tour Guide
Ask me questions while you tour the home.