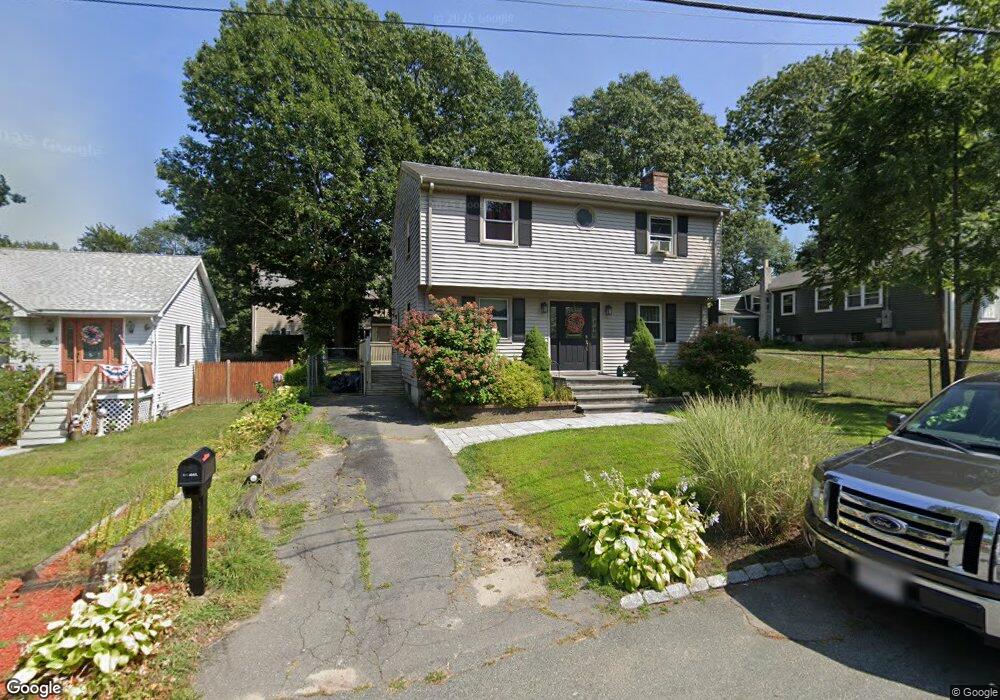
6 E Shore Rd Holbrook, MA 02343
Estimated Value: $534,931 - $603,000
4
Beds
2
Baths
1,500
Sq Ft
$379/Sq Ft
Est. Value
About This Home
This home is located at 6 E Shore Rd, Holbrook, MA 02343 and is currently estimated at $569,233, approximately $379 per square foot. 6 E Shore Rd is a home located in Norfolk County with nearby schools including John F. Kennedy Elementary School, Holbrook Middle High School, and Boston Higashi School.
Ownership History
Date
Name
Owned For
Owner Type
Purchase Details
Closed on
Aug 18, 1998
Sold by
Nehiley Michael and Nehiley Roberta
Bought by
Waldmyer Ralph and Waldmyer Julie
Current Estimated Value
Home Financials for this Owner
Home Financials are based on the most recent Mortgage that was taken out on this home.
Original Mortgage
$143,900
Outstanding Balance
$30,072
Interest Rate
6.94%
Mortgage Type
Purchase Money Mortgage
Estimated Equity
$539,161
Create a Home Valuation Report for This Property
The Home Valuation Report is an in-depth analysis detailing your home's value as well as a comparison with similar homes in the area
Home Values in the Area
Average Home Value in this Area
Purchase History
| Date | Buyer | Sale Price | Title Company |
|---|---|---|---|
| Waldmyer Ralph | $159,900 | -- | |
| Waldmyer Ralph | $159,900 | -- |
Source: Public Records
Mortgage History
| Date | Status | Borrower | Loan Amount |
|---|---|---|---|
| Open | Waldmyer Ralph | $143,900 | |
| Closed | Waldmyer Ralph | $143,900 | |
| Previous Owner | Waldmyer Ralph | $84,000 | |
| Previous Owner | Waldmyer Ralph | $66,000 |
Source: Public Records
Tax History
| Year | Tax Paid | Tax Assessment Tax Assessment Total Assessment is a certain percentage of the fair market value that is determined by local assessors to be the total taxable value of land and additions on the property. | Land | Improvement |
|---|---|---|---|---|
| 2025 | $59 | $444,000 | $185,900 | $258,100 |
| 2024 | $5,936 | $441,700 | $185,700 | $256,000 |
| 2023 | $6,038 | $392,600 | $168,800 | $223,800 |
| 2022 | $5,791 | $351,200 | $153,500 | $197,700 |
| 2021 | $5,669 | $329,200 | $139,200 | $190,000 |
| 2020 | $5,886 | $320,400 | $135,000 | $185,400 |
| 2019 | $5,869 | $301,600 | $126,400 | $175,200 |
| 2018 | $5,945 | $287,600 | $117,000 | $170,600 |
| 2017 | $5,660 | $270,800 | $106,200 | $164,600 |
| 2016 | $5,175 | $263,500 | $103,500 | $160,000 |
| 2015 | $4,768 | $249,900 | $99,000 | $150,900 |
| 2014 | $4,576 | $243,800 | $99,000 | $144,800 |
Source: Public Records
Map
Nearby Homes
- 14 Washington Cir
- 27 Valley Rd
- 58 Chandler St
- 375 S Franklin St Unit 1
- 152 S Franklin St
- 181 S Franklin St Unit 102
- 181 S Franklin St Unit 206
- 27 Winter St
- 36 Summer St
- 276 Center St
- 5 Patterson Ave E
- 327 Union St
- 5 Clarendon Cir Unit Lot 4
- 120 Roberts Ave
- 35 Marion St
- 0 Payson Ave
- 88 Roseen Rd
- 123-125 N Franklin St
- 95 Rindone St
- 7 Oakwood Ave
Your Personal Tour Guide
Ask me questions while you tour the home.