Estimated Value: $223,189 - $317,000
4
Beds
3
Baths
1,242
Sq Ft
$205/Sq Ft
Est. Value
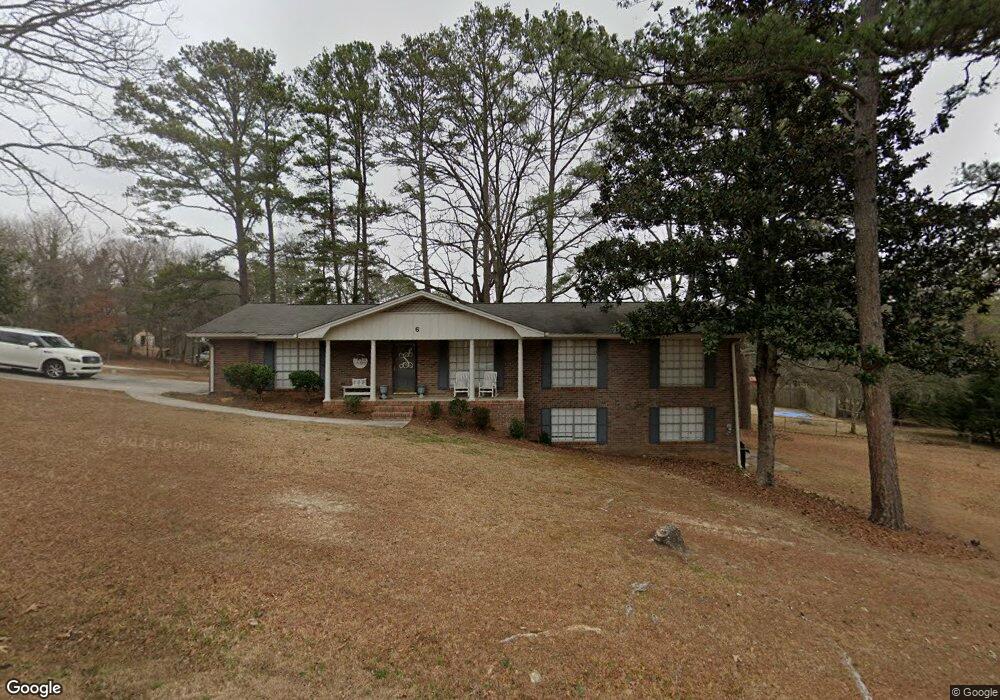
About This Home
This home is located at 6 Eastdell Rd NE, Rome, GA 30161 and is currently estimated at $254,047, approximately $204 per square foot. 6 Eastdell Rd NE is a home located in Floyd County with nearby schools including Model Middle School, Model High School, and Unity Christian School.
Ownership History
Date
Name
Owned For
Owner Type
Purchase Details
Closed on
Feb 28, 2019
Sold by
Guice Sue B Estate
Bought by
Studdard Brandon T
Current Estimated Value
Home Financials for this Owner
Home Financials are based on the most recent Mortgage that was taken out on this home.
Original Mortgage
$149,494
Outstanding Balance
$131,431
Interest Rate
4.4%
Mortgage Type
New Conventional
Estimated Equity
$122,616
Purchase Details
Closed on
Jan 1, 1974
Sold by
Bennett Sam J
Bought by
Bennett Sue C
Purchase Details
Closed on
Jan 1, 1972
Sold by
Rush Denison H
Bought by
Bennett Sam J
Purchase Details
Closed on
Nov 2, 1971
Sold by
Thomas Pearl C
Bought by
Rush Denison H
Purchase Details
Closed on
Feb 3, 1971
Sold by
Thomas Joe
Bought by
Thomas Pearl C
Purchase Details
Closed on
Jul 8, 1969
Sold by
Bryson Jas W
Bought by
Thomas Joe
Purchase Details
Closed on
Jun 15, 1968
Bought by
P and R
Purchase Details
Closed on
Aug 19, 1966
Bought by
Franklin Margaret Y Thompson
Create a Home Valuation Report for This Property
The Home Valuation Report is an in-depth analysis detailing your home's value as well as a comparison with similar homes in the area
Home Values in the Area
Average Home Value in this Area
Purchase History
| Date | Buyer | Sale Price | Title Company |
|---|---|---|---|
| Studdard Brandon T | $148,000 | -- | |
| Bennett Sue C | -- | -- | |
| Bennett Sam J | $31,600 | -- | |
| Rush Denison H | $26,000 | -- | |
| Thomas Pearl C | -- | -- | |
| Thomas Joe | $8,300 | -- | |
| P | -- | -- | |
| Bryson Jas W | -- | -- | |
| Franklin Margaret Y Thompson | -- | -- |
Source: Public Records
Mortgage History
| Date | Status | Borrower | Loan Amount |
|---|---|---|---|
| Open | Studdard Brandon T | $149,494 |
Source: Public Records
Tax History Compared to Growth
Tax History
| Year | Tax Paid | Tax Assessment Tax Assessment Total Assessment is a certain percentage of the fair market value that is determined by local assessors to be the total taxable value of land and additions on the property. | Land | Improvement |
|---|---|---|---|---|
| 2024 | $1,589 | $74,098 | $6,312 | $67,786 |
| 2023 | $879 | $61,134 | $5,341 | $55,793 |
| 2022 | $1,281 | $52,607 | $4,370 | $48,237 |
| 2021 | $1,123 | $42,802 | $4,370 | $38,432 |
| 2020 | $1,022 | $36,783 | $3,399 | $33,384 |
| 2019 | $980 | $32,632 | $3,399 | $29,233 |
| 2018 | $940 | $31,260 | $3,399 | $27,861 |
| 2017 | $892 | $29,589 | $3,399 | $26,190 |
| 2016 | $893 | $29,258 | $3,360 | $25,898 |
| 2015 | $873 | $29,258 | $3,360 | $25,898 |
| 2014 | $873 | $29,258 | $3,360 | $25,898 |
Source: Public Records
Map
Nearby Homes
- 21 Everwood Ct SE
- 406 Fred Kelly Rd NE
- 0 Fallen Branch Cir SE Unit 7397536
- 0 Fallen Branch Cir SE Unit 10311756
- 0 Fallen Branch Cir SE Unit 7234792
- 0 Fallen Branch Cir SE Unit 10172755
- 16 Fallen Branch Cir SE
- 30 Mountain Creek Dr SE
- 567 Fred Kelley Rd NE
- 1 Outpost Trail SE
- 3 Outpost Trail SE
- 0 N Quarters Dr Unit 7467468
- 0 N Quarters Dr Unit 37 10390869
- 0 Mountain Creek Dr SE Unit 10436191
- 158 Sproull Rd SE
- 45 Wildflower Rd NE
- 818 Morrison Camp Ground Rd NE
- 7 Trimble Way SE
- 139 Shoals Ferry Rd SE
- 492 Moran Lake Rd NE
- 2 Parkwood Cir NE
- 4 Parkwood Dr NE Unit 16, PT15
- 4 Parkwood Dr NE
- 3 Eastdell Rd NE
- 1 Parkwood Dr NE
- 0 Parkwood Dr NE Unit 7134612
- 0 Parkwood Dr NE Unit 7087454
- 0 Parkwood Dr NE Unit 8180302
- 0 Parkwood Dr NE Unit 7461402
- 0 Parkwood Dr NE Unit 7010308
- 0 Parkwood Dr NE
- 2821 Kingston Hwy NE
- 6 Parkwood Dr NE
- 3 Parkwood Dr NE
- 10 Eastdell Rd NE
- 1 Eastdell Rd NE
- 7 Eastdell Rd NE
- 38 Parkwood Cir NE
- 40 Parkwood Cir NE
- 40 Parkwood Cir NE Unit 64