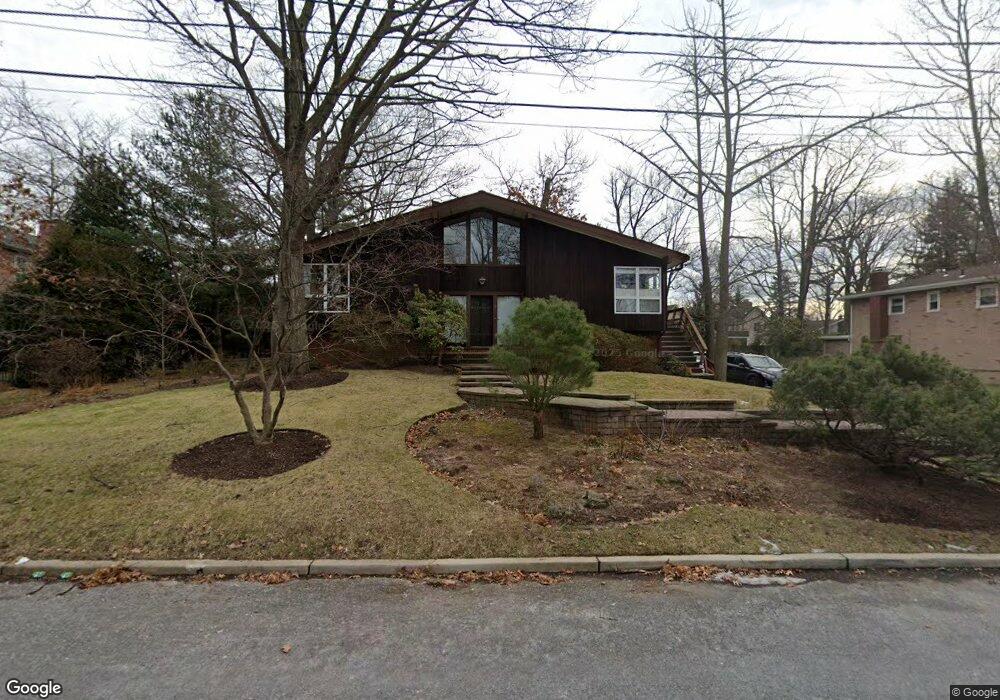
6 Ellington Place Englewood Cliffs, NJ 07632
Estimated Value: $1,727,307 - $1,889,000
--
Bed
--
Bath
3,016
Sq Ft
$606/Sq Ft
Est. Value
About This Home
This home is located at 6 Ellington Place, Englewood Cliffs, NJ 07632 and is currently estimated at $1,827,577, approximately $605 per square foot. 6 Ellington Place is a home located in Bergen County with nearby schools including North Cliff Elementary School, Upper School Elementary School, and Englewood on the Palisades Charter School.
Ownership History
Date
Name
Owned For
Owner Type
Purchase Details
Closed on
May 13, 2022
Sold by
Chapler Harold J and Chapler Ina S
Bought by
Chapler Harold J
Current Estimated Value
Purchase Details
Closed on
Jan 24, 1997
Sold by
United Properties Group Inc
Bought by
Chapler Ina and Chapler Seth
Purchase Details
Closed on
Apr 29, 1996
Sold by
United Properties
Bought by
East Brook Estates
Purchase Details
Closed on
Sep 2, 1994
Sold by
Leslie Leon
Bought by
East Brook Est
Home Financials for this Owner
Home Financials are based on the most recent Mortgage that was taken out on this home.
Original Mortgage
$287,000
Interest Rate
8.44%
Purchase Details
Closed on
Nov 10, 1993
Sold by
Weber Alma
Bought by
East Brook Estate
Create a Home Valuation Report for This Property
The Home Valuation Report is an in-depth analysis detailing your home's value as well as a comparison with similar homes in the area
Home Values in the Area
Average Home Value in this Area
Purchase History
| Date | Buyer | Sale Price | Title Company |
|---|---|---|---|
| Chapler Harold J | -- | Ruffolo Mark E | |
| Chapler Harold J | -- | Ruffolo Mark E | |
| Chapler Ina | $75,000 | -- | |
| East Brook Estates | $99,350 | -- | |
| East Brook Est | $414,585 | -- | |
| East Brook Estate | $125,000 | -- |
Source: Public Records
Mortgage History
| Date | Status | Borrower | Loan Amount |
|---|---|---|---|
| Previous Owner | East Brook Est | $287,000 |
Source: Public Records
Tax History Compared to Growth
Tax History
| Year | Tax Paid | Tax Assessment Tax Assessment Total Assessment is a certain percentage of the fair market value that is determined by local assessors to be the total taxable value of land and additions on the property. | Land | Improvement |
|---|---|---|---|---|
| 2025 | $13,106 | $1,134,700 | $1,007,400 | $127,300 |
| 2024 | $12,947 | $1,134,700 | $1,007,400 | $127,300 |
| 2023 | $12,493 | $1,134,700 | $1,007,400 | $127,300 |
| 2022 | $12,743 | $1,134,700 | $1,007,400 | $127,300 |
| 2021 | $12,504 | $1,134,700 | $1,007,400 | $127,300 |
| 2020 | $13,060 | $1,134,700 | $1,007,400 | $127,300 |
| 2019 | $12,266 | $1,134,700 | $1,007,400 | $127,300 |
| 2018 | $11,835 | $1,134,700 | $1,007,400 | $127,300 |
| 2017 | $11,324 | $1,134,700 | $1,007,400 | $127,300 |
| 2016 | $11,109 | $1,134,700 | $1,007,400 | $127,300 |
| 2015 | $10,303 | $1,134,700 | $1,007,400 | $127,300 |
| 2014 | $9,622 | $1,134,700 | $1,007,400 | $127,300 |
Source: Public Records
Map
Nearby Homes
- 2 Ellington Place
- 232 Lyncrest Rd
- 17 Churchill Rd
- 21 Churchill Rd
- 15 Churchill Rd
- 10 Booth Ave
- 1 Ellington Place
- 9 Churchill Rd
- 240 Lyncrest Rd
- 231 Lyncrest Rd
- 235 Lyncrest Rd
- 227 Lyncrest Rd
- 6 Booth Ave
- 20 Booth Ave
- 18 Churchill Rd
- 22 Churchill Rd
- 237 Lyncrest Rd
- 14 Churchill Rd
- 15 Booth Ave
- 223 Lyncrest Rd