6 Fairview St Hingham, MA 02043
Estimated Value: $1,038,828 - $1,206,000
3
Beds
3
Baths
1,743
Sq Ft
$664/Sq Ft
Est. Value
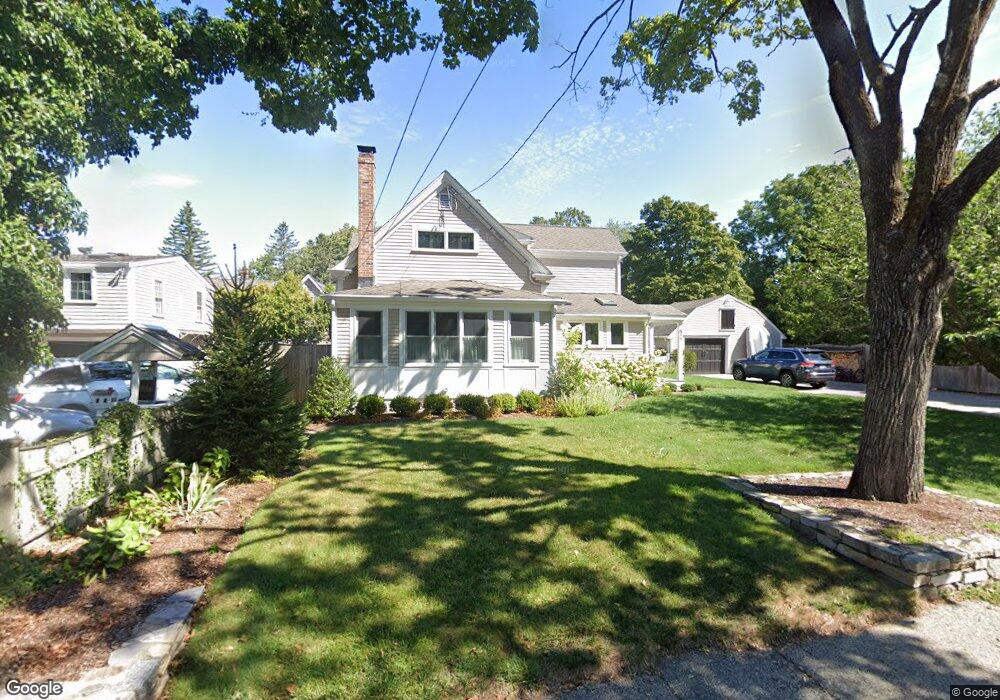
About This Home
This home is located at 6 Fairview St, Hingham, MA 02043 and is currently estimated at $1,157,457, approximately $664 per square foot. 6 Fairview St is a home located in Plymouth County with nearby schools including East Elementary School, Hingham Middle School, and Hingham High School.
Ownership History
Date
Name
Owned For
Owner Type
Purchase Details
Closed on
Jun 4, 2003
Sold by
Kushnir Bradley G and Sullivan Molly S
Bought by
Burt Jonathan E and Burt Kathryn W
Current Estimated Value
Home Financials for this Owner
Home Financials are based on the most recent Mortgage that was taken out on this home.
Original Mortgage
$211,000
Interest Rate
5.83%
Mortgage Type
Purchase Money Mortgage
Purchase Details
Closed on
Dec 8, 1997
Sold by
Phinney Gregg A and Hall Alyson J
Bought by
Sullivan Molly S and Kushnir Bradley G
Purchase Details
Closed on
Aug 1, 1989
Sold by
Shuman Robert S
Bought by
Phinney Gregg A
Purchase Details
Closed on
Nov 12, 1987
Sold by
Knight Frank P
Bought by
Shuman Robert S
Create a Home Valuation Report for This Property
The Home Valuation Report is an in-depth analysis detailing your home's value as well as a comparison with similar homes in the area
Purchase History
| Date | Buyer | Sale Price | Title Company |
|---|---|---|---|
| Burt Jonathan E | $465,000 | -- | |
| Sullivan Molly S | $249,000 | -- | |
| Phinney Gregg A | $190,000 | -- | |
| Shuman Robert S | $196,000 | -- |
Source: Public Records
Mortgage History
| Date | Status | Borrower | Loan Amount |
|---|---|---|---|
| Open | Shuman Robert S | $235,000 | |
| Closed | Shuman Robert S | $211,000 | |
| Previous Owner | Shuman Robert S | $50,000 |
Source: Public Records
Tax History
| Year | Tax Paid | Tax Assessment Tax Assessment Total Assessment is a certain percentage of the fair market value that is determined by local assessors to be the total taxable value of land and additions on the property. | Land | Improvement |
|---|---|---|---|---|
| 2025 | $9,339 | $873,600 | $432,000 | $441,600 |
| 2024 | $8,502 | $783,600 | $432,000 | $351,600 |
| 2023 | $7,672 | $767,200 | $432,000 | $335,200 |
| 2022 | $8,037 | $695,200 | $360,000 | $335,200 |
| 2021 | $7,746 | $656,400 | $360,000 | $296,400 |
| 2020 | $7,568 | $656,400 | $360,000 | $296,400 |
| 2019 | $4,709 | $577,200 | $316,800 | $260,400 |
| 2018 | $6,682 | $567,700 | $316,800 | $250,900 |
| 2017 | $6,382 | $521,000 | $305,600 | $215,400 |
| 2016 | $6,281 | $502,900 | $291,000 | $211,900 |
| 2015 | $6,019 | $480,400 | $277,200 | $203,200 |
Source: Public Records
Map
Nearby Homes
Your Personal Tour Guide
Ask me questions while you tour the home.