Estimated Value: $402,000 - $425,000
4
Beds
4
Baths
2,138
Sq Ft
$194/Sq Ft
Est. Value
About This Home
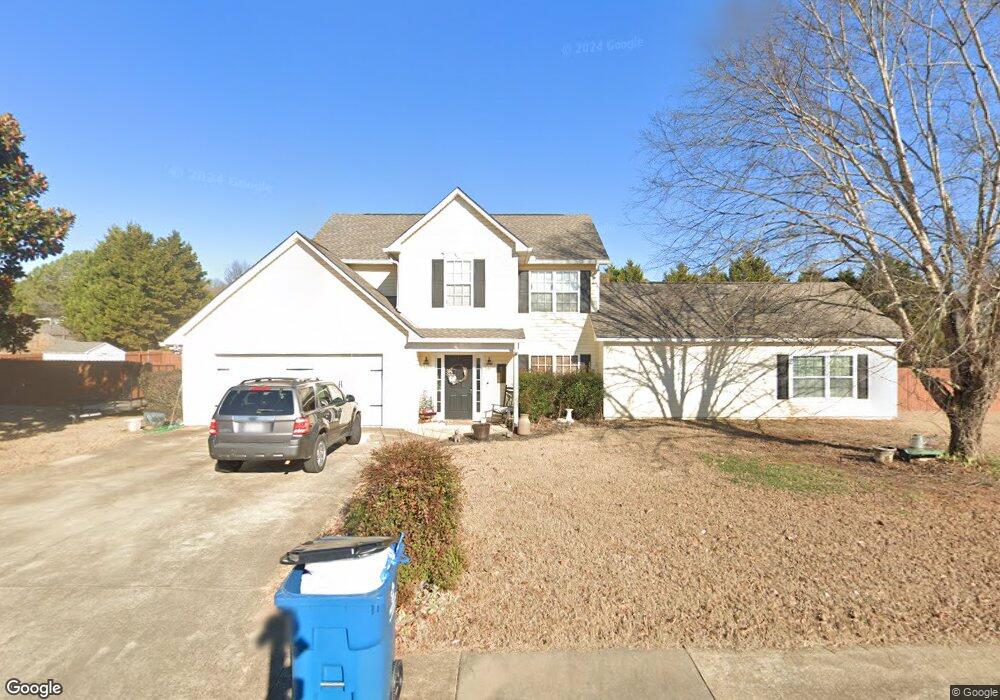
This home is located at 6 Ferry Crossing Dr SE, Rome, GA 30161 and is currently estimated at $414,360, approximately $193 per square foot. 6 Ferry Crossing Dr SE is a home located in Floyd County with nearby schools including Model Middle School and Model High School.
Ownership History
Date
Name
Owned For
Owner Type
Purchase Details
Closed on
Feb 1, 2021
Sold by
Williams Roger
Bought by
Williams Roger and Williams Angela
Current Estimated Value
Home Financials for this Owner
Home Financials are based on the most recent Mortgage that was taken out on this home.
Original Mortgage
$193,732
Outstanding Balance
$174,962
Interest Rate
2.6%
Mortgage Type
FHA
Estimated Equity
$239,398
Purchase Details
Closed on
Nov 23, 2020
Sold by
Neal Melissa
Bought by
Williams Roger
Purchase Details
Closed on
Oct 9, 2009
Sold by
Desmond Jerry R
Bought by
Williams Rogers
Home Financials for this Owner
Home Financials are based on the most recent Mortgage that was taken out on this home.
Original Mortgage
$162,011
Interest Rate
5.03%
Mortgage Type
FHA
Purchase Details
Closed on
Apr 15, 2004
Sold by
Tom Hackett Builder & Developer Inc
Bought by
Desmond Jerry R and Johns Cherry L
Purchase Details
Closed on
Jun 4, 2003
Sold by
Ferry Crossing Development Inc
Bought by
Tom Hackett Builder & Developer Inc
Purchase Details
Closed on
Jul 18, 2001
Bought by
Ferry Crossing Development Inc
Create a Home Valuation Report for This Property
The Home Valuation Report is an in-depth analysis detailing your home's value as well as a comparison with similar homes in the area
Home Values in the Area
Average Home Value in this Area
Purchase History
| Date | Buyer | Sale Price | Title Company |
|---|---|---|---|
| Williams Roger | -- | -- | |
| Williams Roger | -- | -- | |
| Williams Rogers | $165,000 | -- | |
| Desmond Jerry R | $155,700 | -- | |
| Tom Hackett Builder & Developer Inc | $25,200 | -- | |
| Ferry Crossing Development Inc | -- | -- |
Source: Public Records
Mortgage History
| Date | Status | Borrower | Loan Amount |
|---|---|---|---|
| Open | Williams Roger | $193,732 | |
| Closed | Williams Roger | $193,732 | |
| Previous Owner | Williams Rogers | $162,011 |
Source: Public Records
Tax History Compared to Growth
Tax History
| Year | Tax Paid | Tax Assessment Tax Assessment Total Assessment is a certain percentage of the fair market value that is determined by local assessors to be the total taxable value of land and additions on the property. | Land | Improvement |
|---|---|---|---|---|
| 2024 | $3,318 | $149,340 | $14,700 | $134,640 |
| 2023 | $3,318 | $128,677 | $14,700 | $113,977 |
| 2022 | $2,513 | $96,955 | $14,000 | $82,955 |
| 2021 | $2,077 | $71,100 | $14,000 | $57,100 |
| 2020 | $2,034 | $68,271 | $14,000 | $54,271 |
| 2019 | $1,959 | $65,863 | $14,000 | $51,863 |
| 2018 | $1,731 | $56,943 | $14,000 | $42,943 |
| 2017 | $1,885 | $61,962 | $14,000 | $47,962 |
| 2016 | $1,887 | $61,240 | $14,000 | $47,240 |
| 2015 | -- | $58,960 | $14,000 | $44,960 |
| 2014 | -- | $57,920 | $14,000 | $43,920 |
Source: Public Records
Map
Nearby Homes
- 11 Seay Dr SE
- 3 Outpost Trail SE
- 1 Outpost Trail SE
- 5 Archway Ct SE
- 16 Fallen Branch Cir SE
- 0 Fallen Branch Cir SE Unit 7397536
- 0 Fallen Branch Cir SE Unit 10311756
- 0 Fallen Branch Cir SE Unit 7234792
- 0 Fallen Branch Cir SE Unit 10172755
- 6 Hollow Crest Ct SE
- 0 N Quarters Dr Unit 7467468
- 0 N Quarters Dr Unit 37 10390869
- 25 Everwood Ct SE
- 21 Everwood Ct SE
- 139 Shoals Ferry Rd SE
- 19 Trimble Way
- 33 Mountain Creek Dr SE
- 9 Trimble Way SE
- 7 Trimble Way SE
- 0 Mountain Creek Dr SE Unit 10436191
- 0 Wagnon Ct SE Unit 7243578
- 0 Wagnon Ct SE Unit 7066724
- 0 Wagnon Ct SE Unit 3270485
- 0 Wagnon Ct SE Unit 8820872
- 0 Wagnon Ct SE Unit 8344667
- 0 Wagnon Ct SE Unit 8305890
- 0 Wagnon Ct SE Unit 8074143
- 0 Wagnon Ct SE Unit 7631332
- 0 Wagnon Ct SE Unit 7602847
- 0 Wagnon Ct SE Unit 8246994
- 0 Wagnon Ct SE Unit 7502099
- 0 Wagnon Ct SE Unit 7167333
- 0 Wagnon Ct SE
- 4 Wagnon Ct SE
- 7 Wagnon Ct SE
- 8 Ferry Crossing Dr SE
- 2 Ferry Crossing Dr SE
- 5 Ferry Crossing Dr SE
- 7 Ferry Crossing Dr SE
- 3 Ferry Crossing Dr SE