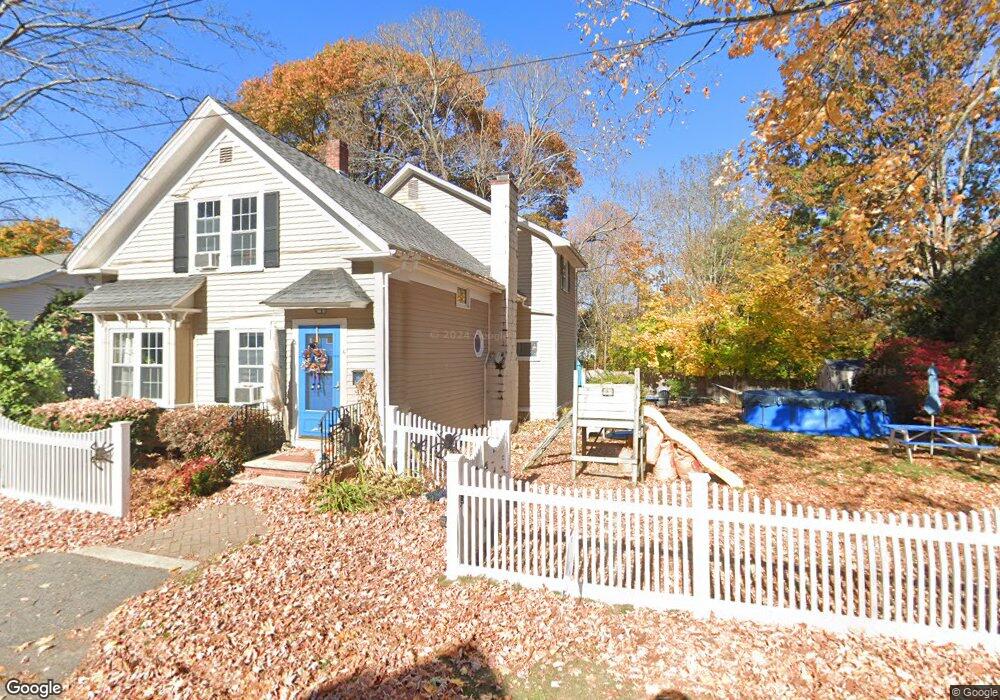
6 Field St Amesbury, MA 01913
Estimated Value: $573,978 - $610,000
4
Beds
2
Baths
1,318
Sq Ft
$453/Sq Ft
Est. Value
About This Home
This home is located at 6 Field St, Amesbury, MA 01913 and is currently estimated at $597,245, approximately $453 per square foot. 6 Field St is a home located in Essex County with nearby schools including Amesbury High School and Amesbury Seventh-Day Adventist School.
Ownership History
Date
Name
Owned For
Owner Type
Purchase Details
Closed on
Dec 3, 2021
Sold by
Sablock Jeanette M and Sablock Peter E
Bought by
Currie Katherine J and Sablock Jeanette M
Current Estimated Value
Purchase Details
Closed on
Oct 16, 2013
Sold by
Sullivan Edward F and Sullivan Linda M
Bought by
Sablock Peter E and Sablock Jeanette M
Home Financials for this Owner
Home Financials are based on the most recent Mortgage that was taken out on this home.
Original Mortgage
$223,650
Interest Rate
4.58%
Mortgage Type
New Conventional
Create a Home Valuation Report for This Property
The Home Valuation Report is an in-depth analysis detailing your home's value as well as a comparison with similar homes in the area
Home Values in the Area
Average Home Value in this Area
Purchase History
| Date | Buyer | Sale Price | Title Company |
|---|---|---|---|
| Currie Katherine J | -- | None Available | |
| Sablock Peter E | $248,500 | -- |
Source: Public Records
Mortgage History
| Date | Status | Borrower | Loan Amount |
|---|---|---|---|
| Previous Owner | Sablock Peter E | $223,650 |
Source: Public Records
Tax History
| Year | Tax Paid | Tax Assessment Tax Assessment Total Assessment is a certain percentage of the fair market value that is determined by local assessors to be the total taxable value of land and additions on the property. | Land | Improvement |
|---|---|---|---|---|
| 2025 | $7,474 | $488,500 | $206,300 | $282,200 |
| 2024 | $7,076 | $452,400 | $194,600 | $257,800 |
| 2023 | $10,969 | $427,000 | $169,200 | $257,800 |
| 2022 | $10,538 | $362,300 | $147,200 | $215,100 |
| 2021 | $10,014 | $334,100 | $113,600 | $220,500 |
| 2020 | $5,412 | $315,000 | $109,300 | $205,700 |
| 2019 | $4,548 | $295,100 | $109,300 | $185,800 |
| 2018 | $5,239 | $275,900 | $104,100 | $171,800 |
| 2017 | $5,037 | $252,500 | $104,100 | $148,400 |
| 2016 | $5,001 | $246,600 | $104,100 | $142,500 |
| 2015 | $4,921 | $239,600 | $104,100 | $135,500 |
| 2014 | $4,685 | $223,400 | $104,100 | $119,300 |
Source: Public Records
Map
Nearby Homes
- 21 River St
- 4 Clark St
- 4 Greenwood St
- 97 Elm St
- 25 Cedar St Unit 4
- 21 Congress St
- 253 Main St
- 1 Hillside Ave Unit 3
- 101 Market St Unit B
- 105 Market St Unit B
- 3 Tremont Ave Unit A
- 48 Orchard St
- 5 Russell St Unit 1
- 382 Main St
- 149 Market St
- 7 Hoyt Ave
- 3 Birchwood Point Unit 202
- 82 Monroe St
- 7 Birchwood Pointe Unit 101
- 47 Cutter Ln Unit 47
Your Personal Tour Guide
Ask me questions while you tour the home.