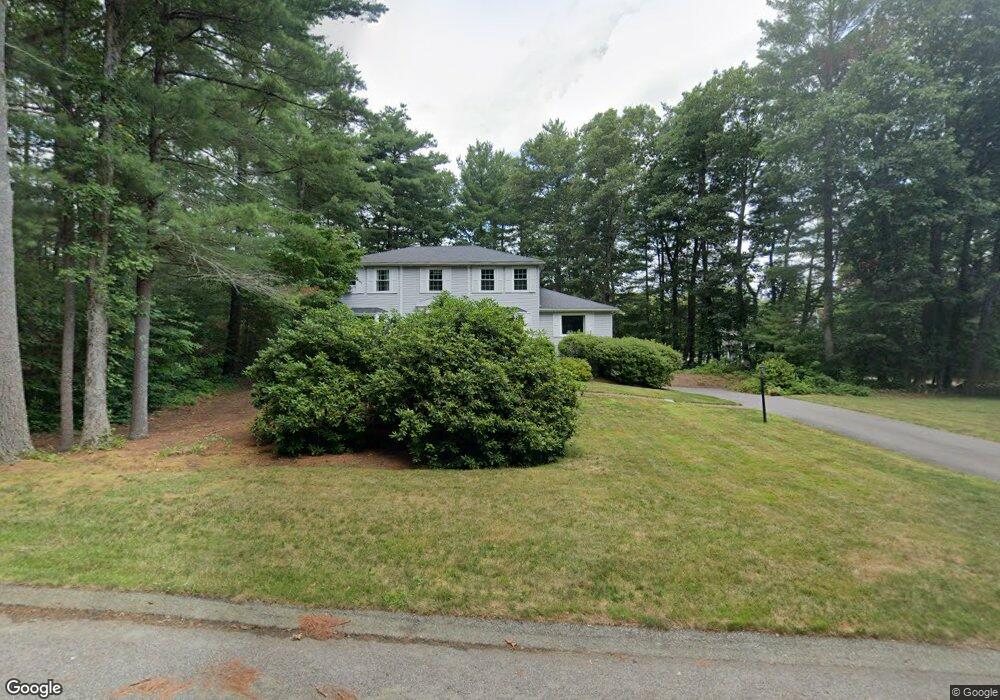
6 Flintlock Ln Canton, MA 02021
Estimated Value: $962,000 - $1,200,000
4
Beds
3
Baths
2,588
Sq Ft
$410/Sq Ft
Est. Value
About This Home
This home is located at 6 Flintlock Ln, Canton, MA 02021 and is currently estimated at $1,061,925, approximately $410 per square foot. 6 Flintlock Ln is a home located in Norfolk County with nearby schools including Canton High School and St. John the Evangelist School.
Ownership History
Date
Name
Owned For
Owner Type
Purchase Details
Closed on
Jun 17, 1994
Sold by
Marvin Luke W
Bought by
Obrien Francis M and Obrien Mariann M
Current Estimated Value
Home Financials for this Owner
Home Financials are based on the most recent Mortgage that was taken out on this home.
Original Mortgage
$134,000
Interest Rate
8.5%
Mortgage Type
Purchase Money Mortgage
Create a Home Valuation Report for This Property
The Home Valuation Report is an in-depth analysis detailing your home's value as well as a comparison with similar homes in the area
Home Values in the Area
Average Home Value in this Area
Purchase History
| Date | Buyer | Sale Price | Title Company |
|---|---|---|---|
| Obrien Francis M | $267,000 | -- |
Source: Public Records
Mortgage History
| Date | Status | Borrower | Loan Amount |
|---|---|---|---|
| Open | Obrien Francis M | $110,000 | |
| Closed | Obrien Francis M | $122,000 | |
| Closed | Obrien Francis M | $134,000 | |
| Previous Owner | Obrien Francis M | $110,000 |
Source: Public Records
Tax History
| Year | Tax Paid | Tax Assessment Tax Assessment Total Assessment is a certain percentage of the fair market value that is determined by local assessors to be the total taxable value of land and additions on the property. | Land | Improvement |
|---|---|---|---|---|
| 2025 | $8,429 | $852,300 | $342,500 | $509,800 |
| 2024 | $8,243 | $826,800 | $329,400 | $497,400 |
| 2023 | $7,947 | $751,800 | $329,400 | $422,400 |
| 2022 | $7,656 | $674,500 | $313,700 | $360,800 |
| 2021 | $7,451 | $610,700 | $285,100 | $325,600 |
| 2020 | $7,117 | $581,900 | $271,600 | $310,300 |
| 2019 | $7,061 | $569,400 | $246,800 | $322,600 |
| 2018 | $7,071 | $569,300 | $258,900 | $310,400 |
| 2017 | $7,143 | $558,500 | $253,900 | $304,600 |
| 2016 | $6,861 | $536,400 | $239,000 | $297,400 |
| 2015 | $6,695 | $522,200 | $232,000 | $290,200 |
Source: Public Records
Map
Nearby Homes
- 140 York St
- 79 Gold St
- 902 Irving Rd Unit 902
- 232 Canton St Unit 308
- 232 Canton St Unit 104
- 5 Linden Glen Rd
- 50 Indian Ln
- 106 Indian Ln
- 33 Kelly Way Unit 33
- 33 Michael Rd
- 25 Edward St
- 195 High St
- 116 Indian Ln
- 10 Michael Rd
- 1831 Turnpike St
- 888 Turnpike St
- 43 Emily Jeffers Rd
- 4 Franklin Square Unit 4F
- 51 Himoor Cir
- 59 Turnpike St
Your Personal Tour Guide
Ask me questions while you tour the home.