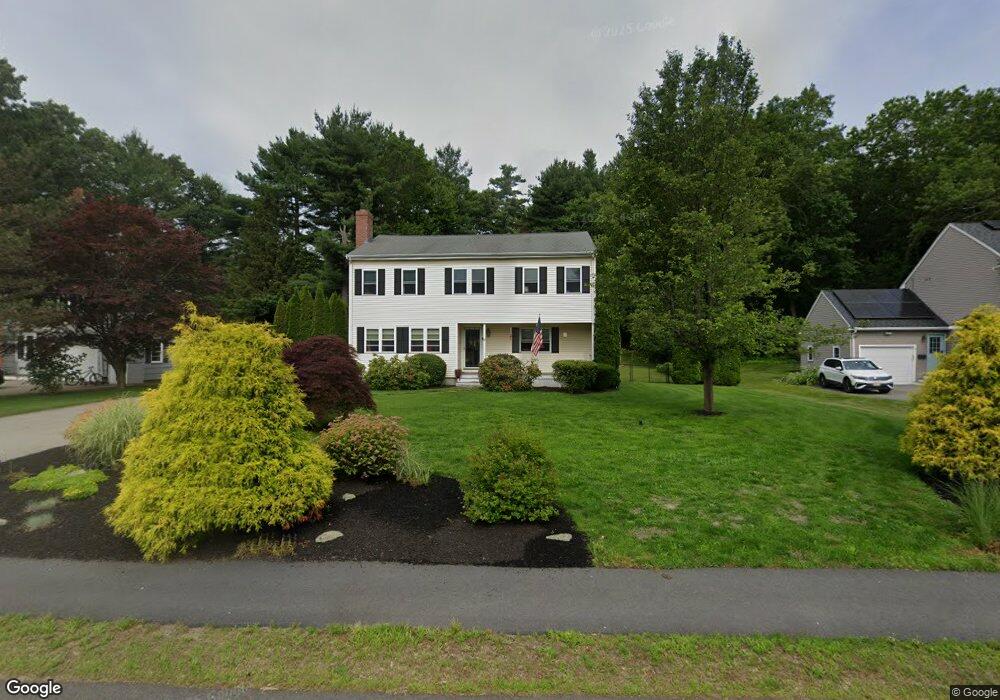
6 Flonun St Walpole, MA 02081
Estimated Value: $798,000 - $894,000
3
Beds
3
Baths
2,129
Sq Ft
$391/Sq Ft
Est. Value
About This Home
This home is located at 6 Flonun St, Walpole, MA 02081 and is currently estimated at $832,118, approximately $390 per square foot. 6 Flonun St is a home located in Norfolk County with nearby schools including Boyden School, Eleanor N. Johnson Middle School, and Walpole High School.
Ownership History
Date
Name
Owned For
Owner Type
Purchase Details
Closed on
Mar 3, 2003
Sold by
Flonun Avenue T and Moses George R
Bought by
Chaffee Kristen A and Flate Steven
Current Estimated Value
Home Financials for this Owner
Home Financials are based on the most recent Mortgage that was taken out on this home.
Original Mortgage
$360,100
Outstanding Balance
$155,936
Interest Rate
5.98%
Mortgage Type
Purchase Money Mortgage
Estimated Equity
$676,182
Purchase Details
Closed on
Sep 10, 2002
Sold by
Est Wraga John M and Wraga John M
Bought by
Flonun Avenue T
Create a Home Valuation Report for This Property
The Home Valuation Report is an in-depth analysis detailing your home's value as well as a comparison with similar homes in the area
Home Values in the Area
Average Home Value in this Area
Purchase History
| Date | Buyer | Sale Price | Title Company |
|---|---|---|---|
| Chaffee Kristen A | $450,200 | -- | |
| Flonun Avenue T | $265,000 | -- |
Source: Public Records
Mortgage History
| Date | Status | Borrower | Loan Amount |
|---|---|---|---|
| Open | Chaffee Kristen A | $360,100 |
Source: Public Records
Tax History Compared to Growth
Tax History
| Year | Tax Paid | Tax Assessment Tax Assessment Total Assessment is a certain percentage of the fair market value that is determined by local assessors to be the total taxable value of land and additions on the property. | Land | Improvement |
|---|---|---|---|---|
| 2025 | $9,621 | $749,900 | $321,300 | $428,600 |
| 2024 | $9,307 | $704,000 | $308,800 | $395,200 |
| 2023 | $8,962 | $645,200 | $268,600 | $376,600 |
| 2022 | $8,391 | $580,300 | $248,700 | $331,600 |
| 2021 | $8,152 | $549,300 | $234,600 | $314,700 |
| 2020 | $7,970 | $531,700 | $221,400 | $310,300 |
| 2019 | $7,669 | $507,900 | $212,900 | $295,000 |
| 2018 | $7,343 | $480,900 | $205,200 | $275,700 |
| 2017 | $7,136 | $465,500 | $197,300 | $268,200 |
| 2016 | $6,932 | $445,500 | $189,700 | $255,800 |
| 2015 | $6,467 | $411,900 | $180,600 | $231,300 |
| 2014 | $6,232 | $395,400 | $180,600 | $214,800 |
Source: Public Records
Map
Nearby Homes
- 587 Common St
- 69 Morningside Dr
- 635 Old Post Rd Unit 303
- 635 Old Post Rd Unit 302
- 0 U S Route 1
- 1156 Washington St
- 52 Baker St
- 8 Rainbow Pond Dr Unit 8
- 1549 Washington St Unit A
- 145 South St Unit 5
- 145 South St Unit 19
- 305 Centre Ln
- 103 Centre Ln
- 1 Palace Ct
- 66 Oak St
- 8 Autumn Ln
- 224 School St Unit 10
- 1391 Main St Unit 304
- 1391 Main St Unit 208
- 1391 Main St Unit 305