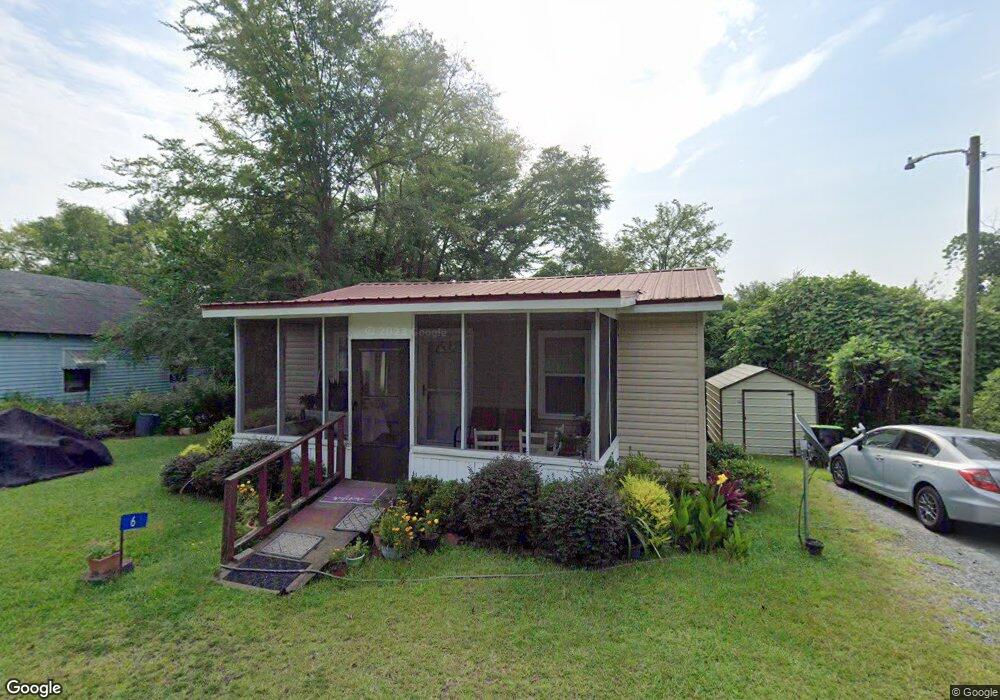
6 Fon Carson Alley Reynolds, GA 31076
Estimated Value: $55,164 - $132,000
--
Bed
--
Bath
715
Sq Ft
$114/Sq Ft
Est. Value
About This Home
This home is located at 6 Fon Carson Alley, Reynolds, GA 31076 and is currently estimated at $81,291, approximately $113 per square foot. 6 Fon Carson Alley is a home with nearby schools including Taylor County Upper Elementary School, Taylor County Primary School, and Taylor County Middle School.
Ownership History
Date
Name
Owned For
Owner Type
Purchase Details
Closed on
Jul 4, 2025
Sold by
Foy Terrell Myron
Bought by
Tripp Susie Montford and Wornum Mozelle Foy
Current Estimated Value
Purchase Details
Closed on
May 31, 2013
Sold by
Wornum Mozelle Foy
Bought by
Wornum Mozelle Foy and Tripp Susle Montford
Purchase Details
Closed on
Feb 20, 1984
Sold by
Montford Mack
Create a Home Valuation Report for This Property
The Home Valuation Report is an in-depth analysis detailing your home's value as well as a comparison with similar homes in the area
Home Values in the Area
Average Home Value in this Area
Purchase History
| Date | Buyer | Sale Price | Title Company |
|---|---|---|---|
| Tripp Susie Montford | -- | -- | |
| Wornum Mozelle Foy | -- | -- | |
| -- | -- | -- |
Source: Public Records
Tax History Compared to Growth
Tax History
| Year | Tax Paid | Tax Assessment Tax Assessment Total Assessment is a certain percentage of the fair market value that is determined by local assessors to be the total taxable value of land and additions on the property. | Land | Improvement |
|---|---|---|---|---|
| 2024 | $363 | $14,800 | $1,120 | $13,680 |
| 2023 | $268 | $11,760 | $1,120 | $10,640 |
| 2022 | $280 | $11,120 | $1,120 | $10,000 |
| 2021 | $219 | $10,520 | $1,120 | $9,400 |
| 2020 | $221 | $10,520 | $1,120 | $9,400 |
| 2019 | $224 | $10,520 | $1,120 | $9,400 |
| 2018 | $362 | $10,520 | $1,120 | $9,400 |
| 2017 | $62 | $10,100 | $1,300 | $8,800 |
| 2016 | $52 | $9,238 | $1,300 | $7,938 |
| 2015 | -- | $9,238 | $1,300 | $7,938 |
| 2014 | -- | $9,942 | $1,000 | $8,942 |
| 2013 | -- | $5,727 | $1,000 | $4,727 |
Source: Public Records
Map
Nearby Homes
- 25 W Marion St
- 46 E Calhoun St
- 29 Mimms St
- 46 S Collins St
- 0 Macon Rd Unit 24182740
- 171 Thomas Rd
- 0 Booker t Rd Unit 10618603
- 0 Thomas Rd
- 0 Briar Patch Way Unit 10546919
- 0 Hicks Rd Unit LOT 1 10585746
- 0 Hicks Rd Unit 23374480
- 160 Underwood Rd
- 30 Potterville Main St
- 30 Pottervile Main St
- 296 Boxwood Rd
- Cummings Rd
- 262 W Lawson Merritt Rd
- 129 Gaultney-Horne Rd
- 1800 Cummings Rd
- 0 Oak Ridge Dr
- 8 Fon Carson Alley
- 48 N Macon St
- 17 E Harris St
- 67 N Collins St
- 55 N Collins St
- 66 N Collins St
- 33 E Harris St
- 34 N Macon St
- 54 N Macon St
- 53 N Collins St
- 41 N Macon St
- 35 E Harris St
- 49 N Macon St
- 51 N Macon St
- 55 N Macon St
- 32 S Macon St
- 49 N Collins St
- 12 E Harris St
- 36 Parker St
- 24 Fon Carson Alley