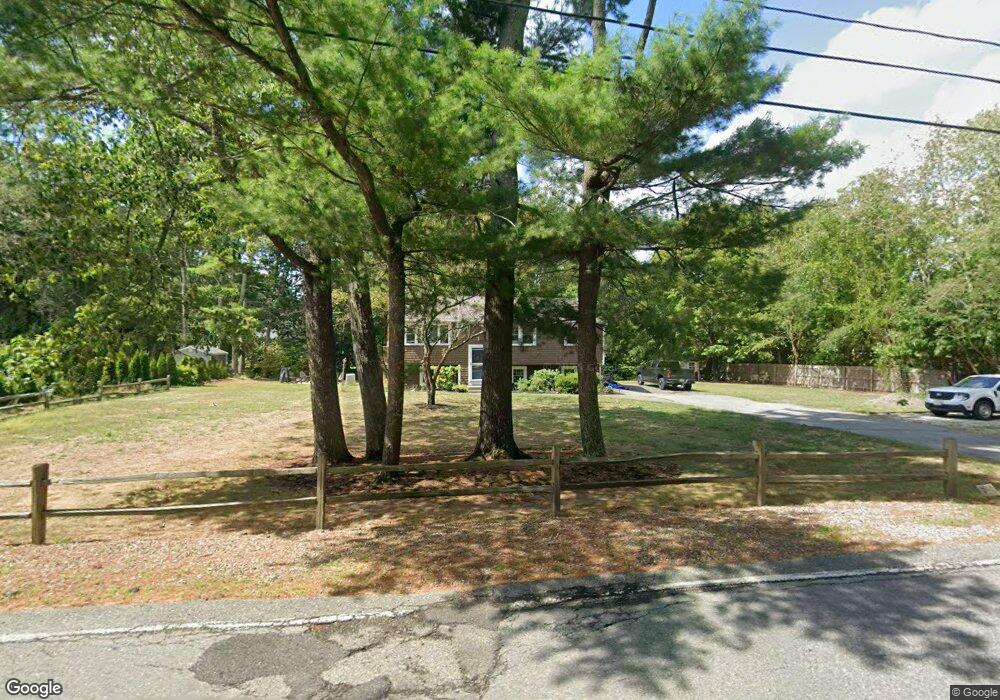
6 Forest St Carver, MA 02330
Estimated Value: $495,000 - $513,000
3
Beds
2
Baths
960
Sq Ft
$526/Sq Ft
Est. Value
About This Home
This home is located at 6 Forest St, Carver, MA 02330 and is currently estimated at $504,929, approximately $525 per square foot. 6 Forest St is a home located in Plymouth County with nearby schools including Carver Elementary School, Carver Middle/High School, and Samuel Fuller School.
Ownership History
Date
Name
Owned For
Owner Type
Purchase Details
Closed on
Dec 29, 1995
Sold by
Chase Manhattan Mtg
Bought by
Madore John R and Madore Laurie J
Current Estimated Value
Purchase Details
Closed on
Sep 26, 1995
Sold by
Gilson Jeffrey C and Chase Manhattan Mtg
Bought by
Chase Manhattan Mtg
Purchase Details
Closed on
Sep 10, 1993
Sold by
Chodor Paul A and Chodor Linda J
Bought by
Gilson Jeffrey C and Gilson Debra K
Create a Home Valuation Report for This Property
The Home Valuation Report is an in-depth analysis detailing your home's value as well as a comparison with similar homes in the area
Home Values in the Area
Average Home Value in this Area
Purchase History
| Date | Buyer | Sale Price | Title Company |
|---|---|---|---|
| Madore John R | $100,000 | -- | |
| Chase Manhattan Mtg | $120,000 | -- | |
| Gilson Jeffrey C | $119,500 | -- |
Source: Public Records
Mortgage History
| Date | Status | Borrower | Loan Amount |
|---|---|---|---|
| Open | Gilson Jeffrey C | $51,285 | |
| Open | Gilson Jeffrey C | $288,000 |
Source: Public Records
Tax History Compared to Growth
Tax History
| Year | Tax Paid | Tax Assessment Tax Assessment Total Assessment is a certain percentage of the fair market value that is determined by local assessors to be the total taxable value of land and additions on the property. | Land | Improvement |
|---|---|---|---|---|
| 2025 | $5,823 | $419,800 | $130,700 | $289,100 |
| 2024 | $5,763 | $406,700 | $128,200 | $278,500 |
| 2023 | $5,549 | $380,300 | $128,200 | $252,100 |
| 2022 | $5,660 | $354,200 | $109,600 | $244,600 |
| 2021 | $5,693 | $321,100 | $97,800 | $223,300 |
| 2020 | $5,178 | $301,200 | $91,400 | $209,800 |
| 2019 | $3,002 | $292,800 | $88,800 | $204,000 |
| 2018 | $5,286 | $272,000 | $88,800 | $183,200 |
| 2017 | $5,135 | $259,300 | $85,400 | $173,900 |
| 2016 | $4,079 | $239,500 | $81,300 | $158,200 |
| 2015 | $3,994 | $234,800 | $81,300 | $153,500 |
| 2014 | $3,911 | $229,900 | $102,800 | $127,100 |
Source: Public Records
Map
Nearby Homes
- 35 Silva St
- 38 Cedar Dr
- 32 Doreen Way
- 7 Green St
- 26 Santana Way Unit 26
- 11 Brockton Ave
- 269 Purchase St
- 81 Center St
- 135 Plymouth St
- Lot1 Elk Run Dr
- 235 Main St
- 6 Susan Cir
- 13 Pond View Way
- 48 S Meadow Village
- 146 S Meadow Rd
- 56 Bunnys Rd
- 22 S Meadow Village
- 29 S Meadow Village
- 122 High St
- 6 Twin Pines Ln Unit 6