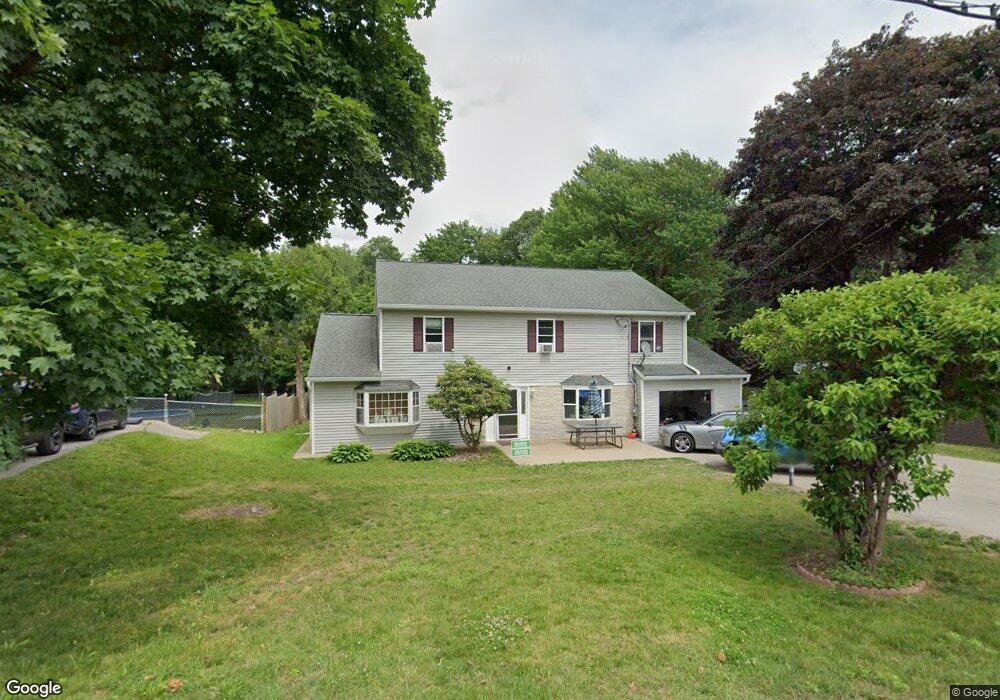
6 Forkey Ave Worcester, MA 01603
Webster Square NeighborhoodEstimated Value: $533,000 - $616,000
7
Beds
4
Baths
2,435
Sq Ft
$231/Sq Ft
Est. Value
About This Home
This home is located at 6 Forkey Ave, Worcester, MA 01603 and is currently estimated at $561,432, approximately $230 per square foot. 6 Forkey Ave is a home located in Worcester County with nearby schools including Gates Lane, Chandler Magnet, and Jacob Hiatt Magnet School.
Ownership History
Date
Name
Owned For
Owner Type
Purchase Details
Closed on
Sep 21, 2023
Sold by
Restrepo Eucario E and Orozco Maria M
Bought by
Restrepo Eucario E and Orozco Maria M
Current Estimated Value
Purchase Details
Closed on
Nov 17, 2006
Sold by
Salas Carmen L and Salas Edwin
Bought by
Restrepo Eucario E and Orozco Maria M
Home Financials for this Owner
Home Financials are based on the most recent Mortgage that was taken out on this home.
Original Mortgage
$200,000
Interest Rate
6.33%
Mortgage Type
Purchase Money Mortgage
Create a Home Valuation Report for This Property
The Home Valuation Report is an in-depth analysis detailing your home's value as well as a comparison with similar homes in the area
Home Values in the Area
Average Home Value in this Area
Purchase History
We collect this data history from publicly available records. To have your information removed, we recommend requesting removal directly through your county’s website.
| Date | Buyer | Sale Price | Title Company |
|---|---|---|---|
| Restrepo Eucario E | -- | None Available | |
| Restrepo Eucario E | $280,000 | -- |
Source: Public Records
Mortgage History
We collect this data history from publicly available records. To have your information removed, we recommend requesting removal directly through your county’s website.
| Date | Status | Borrower | Loan Amount |
|---|---|---|---|
| Previous Owner | Restrepo Eucario E | $200,000 |
Source: Public Records
Tax History
| Year | Tax Paid | Tax Assessment Tax Assessment Total Assessment is a certain percentage of the fair market value that is determined by local assessors to be the total taxable value of land and additions on the property. | Land | Improvement |
|---|---|---|---|---|
| 2025 | $6,300 | $477,600 | $99,400 | $378,200 |
| 2024 | $6,141 | $446,600 | $99,400 | $347,200 |
| 2023 | $5,941 | $414,300 | $86,500 | $327,800 |
| 2022 | $5,536 | $364,000 | $69,200 | $294,800 |
| 2021 | $5,574 | $342,400 | $55,400 | $287,000 |
| 2020 | $5,369 | $315,800 | $54,900 | $260,900 |
| 2019 | $5,164 | $286,900 | $48,300 | $238,600 |
| 2018 | $5,106 | $270,000 | $48,300 | $221,700 |
| 2017 | $5,024 | $261,400 | $48,300 | $213,100 |
| 2016 | $5,338 | $259,000 | $35,700 | $223,300 |
| 2015 | $5,198 | $259,000 | $35,700 | $223,300 |
| 2014 | $5,061 | $259,000 | $35,700 | $223,300 |
Source: Public Records
Map
Nearby Homes
- 18 Sherer Trail
- 30 Parsons Hill Dr
- 386 June St
- 11 Wayne St
- 60 Circuit Ave S
- 168 Apricot St
- 15 Circuit Ave E
- 14 Circuit Ave E
- 23 Lakewood St
- 19 Healy Rd
- 28 Lakewood St
- 1560 Main St
- 1511 Main St Unit CPH9
- 92-94 Sargent St
- 114 Lovell St
- 10 Minthorne St
- 25 Ludlow St
- 11 Hulbert Rd Unit 15
- 2 Stevens Rd
- 1038 Main St
Your Personal Tour Guide
Ask me questions while you tour the home.