Estimated Value: $826,000 - $944,000
5
Beds
5
Baths
7,396
Sq Ft
$119/Sq Ft
Est. Value
About This Home
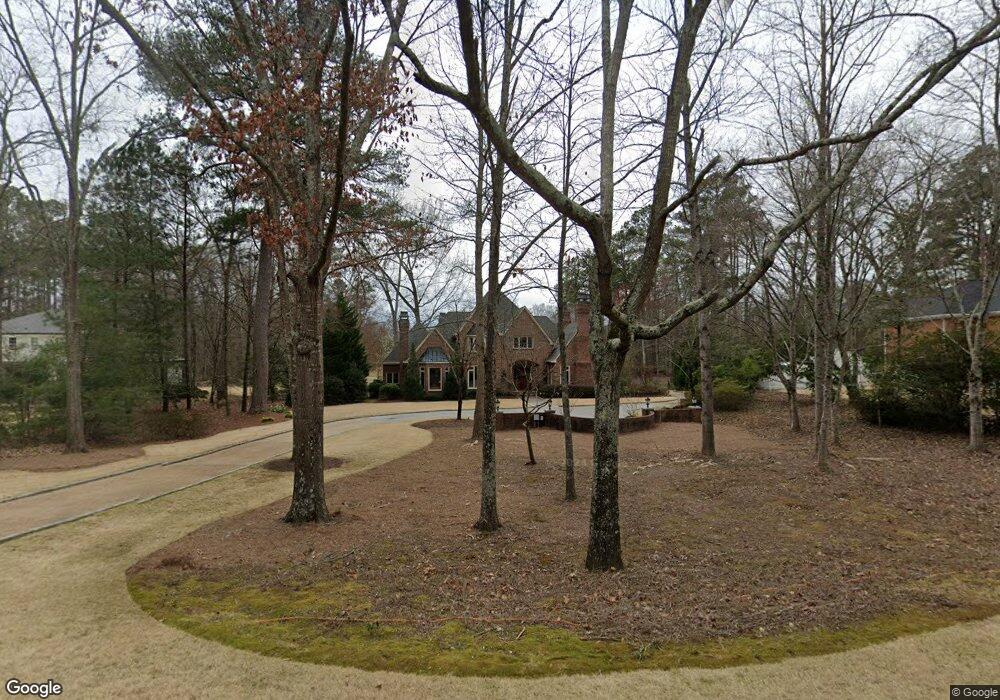
This home is located at 6 Fox Chase SW, Rome, GA 30165 and is currently estimated at $878,973, approximately $118 per square foot. 6 Fox Chase SW is a home located in Floyd County with nearby schools including Coosa Middle School and Coosa High School.
Ownership History
Date
Name
Owned For
Owner Type
Purchase Details
Closed on
Jun 7, 2016
Sold by
Spears Herman Edward
Bought by
Harrison Jason F and Harrison Katrina
Current Estimated Value
Home Financials for this Owner
Home Financials are based on the most recent Mortgage that was taken out on this home.
Original Mortgage
$846,450
Outstanding Balance
$673,680
Interest Rate
3.57%
Mortgage Type
New Conventional
Estimated Equity
$205,293
Purchase Details
Closed on
Jul 13, 2010
Sold by
Miller Richard R
Bought by
Spears Herman Edward
Purchase Details
Closed on
Jul 12, 2010
Bought by
P and R
Purchase Details
Closed on
Feb 16, 1987
Sold by
Hoyt Elizabeth T and Hoyt Nathan B
Bought by
Miller Richard R and Miller Patti C
Purchase Details
Closed on
Apr 10, 1986
Sold by
Jones Jones L and Jones Frank B
Bought by
Hoyt Elizabeth T and Hoyt Nathan B
Purchase Details
Closed on
Feb 3, 1971
Bought by
Jones Jones L and Jones Frank B
Create a Home Valuation Report for This Property
The Home Valuation Report is an in-depth analysis detailing your home's value as well as a comparison with similar homes in the area
Home Values in the Area
Average Home Value in this Area
Purchase History
| Date | Buyer | Sale Price | Title Company |
|---|---|---|---|
| Harrison Jason F | $891,000 | -- | |
| Spears Herman Edward | $267,500 | -- | |
| P | $3,500 | -- | |
| Miller Richard R | -- | -- | |
| Hoyt Elizabeth T | -- | -- | |
| Jones Jones L | -- | -- |
Source: Public Records
Mortgage History
| Date | Status | Borrower | Loan Amount |
|---|---|---|---|
| Open | Harrison Jason F | $846,450 |
Source: Public Records
Tax History Compared to Growth
Tax History
| Year | Tax Paid | Tax Assessment Tax Assessment Total Assessment is a certain percentage of the fair market value that is determined by local assessors to be the total taxable value of land and additions on the property. | Land | Improvement |
|---|---|---|---|---|
| 2024 | $10,438 | $364,707 | $11,669 | $353,038 |
| 2023 | $10,520 | $354,597 | $10,608 | $343,989 |
| 2022 | $8,969 | $299,366 | $8,568 | $290,798 |
| 2021 | $8,325 | $273,032 | $7,800 | $265,232 |
| 2020 | $8,032 | $261,294 | $6,782 | $254,512 |
| 2019 | $7,184 | $236,699 | $5,864 | $230,835 |
| 2018 | $7,193 | $236,699 | $5,864 | $230,835 |
| 2017 | $6,139 | $236,699 | $5,864 | $230,835 |
| 2016 | $5,397 | $216,280 | $5,840 | $210,440 |
| 2015 | $4,470 | $216,280 | $5,840 | $210,440 |
| 2014 | $4,470 | $174,966 | $5,840 | $169,126 |
Source: Public Records
Map
Nearby Homes
- 21 River Pine Dr SW
- 0 Belle Meade Dr SW Unit 10504645
- 5 Saint Andrews Way SW
- 30 Fairview Dr SW
- 186 Fairview Dr SW
- 0 Radio Springs Rd SW Unit 10587642
- 0 Radio Springs Rd SW Unit 10587644
- 0 Radio Springs Rd SW Unit 10587646
- 11 Brow Rd SW
- 0 Hidden Ridge Dr Unit 10343694
- 0 Hidden Ridge Dr Unit 10343706
- 0 Hidden Ridge Dr Unit 10343701
- 0 Hidden Ridge Dr Unit 10343693
- 0 Hidden Ridge Dr Unit 10343685
- 0 Hidden Ridge Dr Unit 10556470
- 0 Hidden Ridge Dr Unit 10343688
- 0 Hidden Ridge Dr Unit 10343680
- 0 Hidden Ridge Dr Unit 10343696
- 0 Hidden Ridge Dr Unit 10343689
- 0 Hidden Ridge Dr Unit 10343700
- 4 Fox Chase SW
- 8 Fox Chase SW
- 10 Fox Chase SW
- 10 Fox Chase SW
- 10 Fox Chase SW
- 2 Fox Chase SW
- 1 Fox Chase SW
- 5 Fox Chase SW
- 12 River Pine Dr SW
- 22 River Place Dr SW
- 12 Fox Chase SW
- 14 River Pine Dr SW
- 14 River Pine Dr SW
- 9 River Pine Dr SW
- 10 River Pine Dr SW
- 21 River Place Dr SW
- 11 River Pine Dr SW
- 9 Fox Chase SW
- 20 River Place Dr SW
- 11 River Place Dr SW