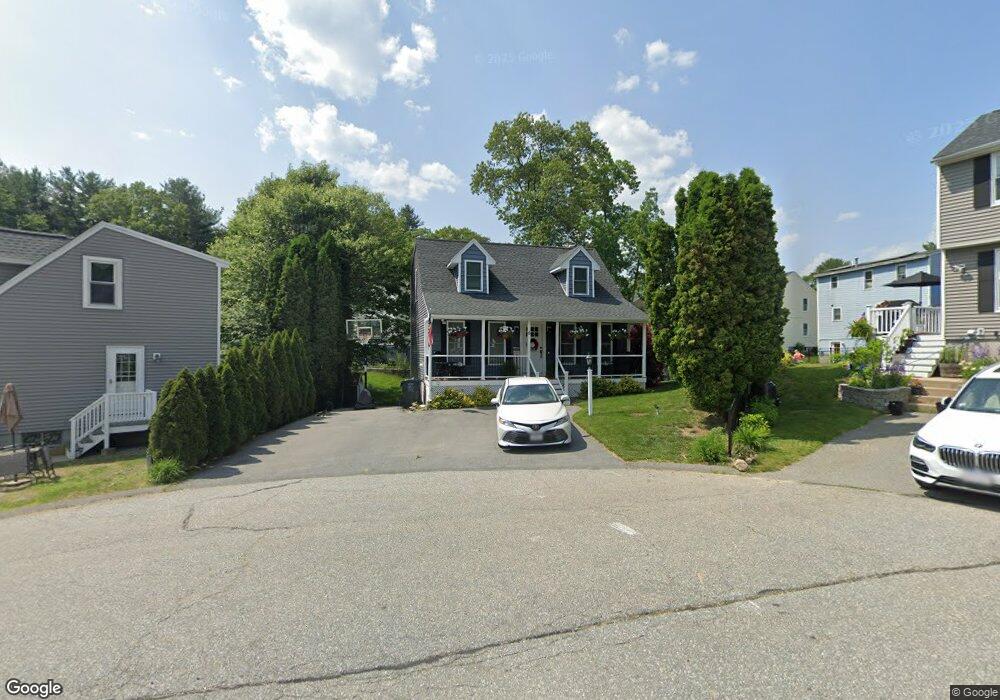
6 Freds Cir Dracut, MA 01826
Estimated Value: $521,000 - $570,000
3
Beds
2
Baths
1,260
Sq Ft
$435/Sq Ft
Est. Value
About This Home
This home is located at 6 Freds Cir, Dracut, MA 01826 and is currently estimated at $547,472, approximately $434 per square foot. 6 Freds Cir is a home located in Middlesex County with nearby schools including George H. Englesby Elementary School, Richardson Middle School, and Dracut Senior High School.
Ownership History
Date
Name
Owned For
Owner Type
Purchase Details
Closed on
Dec 29, 2003
Sold by
Martin Maureen P and Martin Wayne A
Bought by
Crowley Brian J
Current Estimated Value
Home Financials for this Owner
Home Financials are based on the most recent Mortgage that was taken out on this home.
Original Mortgage
$210,400
Outstanding Balance
$99,146
Interest Rate
6.01%
Mortgage Type
Purchase Money Mortgage
Estimated Equity
$448,326
Purchase Details
Closed on
Jan 28, 1993
Sold by
Primrose Residential 2
Bought by
Martin Wayne A and Martin Maureen
Home Financials for this Owner
Home Financials are based on the most recent Mortgage that was taken out on this home.
Original Mortgage
$107,200
Interest Rate
8.16%
Mortgage Type
Purchase Money Mortgage
Create a Home Valuation Report for This Property
The Home Valuation Report is an in-depth analysis detailing your home's value as well as a comparison with similar homes in the area
Home Values in the Area
Average Home Value in this Area
Purchase History
| Date | Buyer | Sale Price | Title Company |
|---|---|---|---|
| Crowley Brian J | $263,000 | -- | |
| Martin Wayne A | $112,900 | -- |
Source: Public Records
Mortgage History
| Date | Status | Borrower | Loan Amount |
|---|---|---|---|
| Open | Crowley Brian J | $210,400 | |
| Previous Owner | Martin Wayne A | $107,200 |
Source: Public Records
Tax History
| Year | Tax Paid | Tax Assessment Tax Assessment Total Assessment is a certain percentage of the fair market value that is determined by local assessors to be the total taxable value of land and additions on the property. | Land | Improvement |
|---|---|---|---|---|
| 2025 | $4,723 | $466,700 | $162,000 | $304,700 |
| 2024 | $4,528 | $433,300 | $154,300 | $279,000 |
| 2023 | $4,365 | $376,900 | $134,200 | $242,700 |
| 2022 | $4,228 | $344,000 | $122,000 | $222,000 |
| 2021 | $4,197 | $322,600 | $110,900 | $211,700 |
| 2020 | $4,049 | $303,300 | $107,600 | $195,700 |
| 2019 | $4,100 | $298,200 | $102,500 | $195,700 |
| 2018 | $3,692 | $261,100 | $102,500 | $158,600 |
| 2017 | $3,441 | $261,100 | $102,500 | $158,600 |
| 2016 | $3,391 | $228,500 | $98,500 | $130,000 |
| 2015 | $3,308 | $221,600 | $98,500 | $123,100 |
| 2014 | $3,131 | $216,100 | $98,500 | $117,600 |
Source: Public Records
Map
Nearby Homes
- 1905 Lakeview Ave
- 53 Vinal St
- 29 Mill St Unit B
- 17 Spare St
- 124 Tennis Plaza Rd Unit 40
- 13 Dallas Dr Unit 305
- 13 Dallas Dr Unit 107
- 74 Tennis Plaza Rd Unit 34
- 94 Tennis Plaza Rd Unit 10
- 83 Turgeon Ave
- 154 New Boston Rd
- 91 Frederick St Unit 77
- 42 Frederick St Unit 9
- 9 Arbor Dr
- 19 Louis Farm Rd Unit 19
- 13 Louis Farm Rd Unit 13
- 15 Louis Farm Rd Unit 15
- 101 Donohue Rd Unit 19
- 109 Navy Yard Rd
- 67 Glennon Ave
Your Personal Tour Guide
Ask me questions while you tour the home.