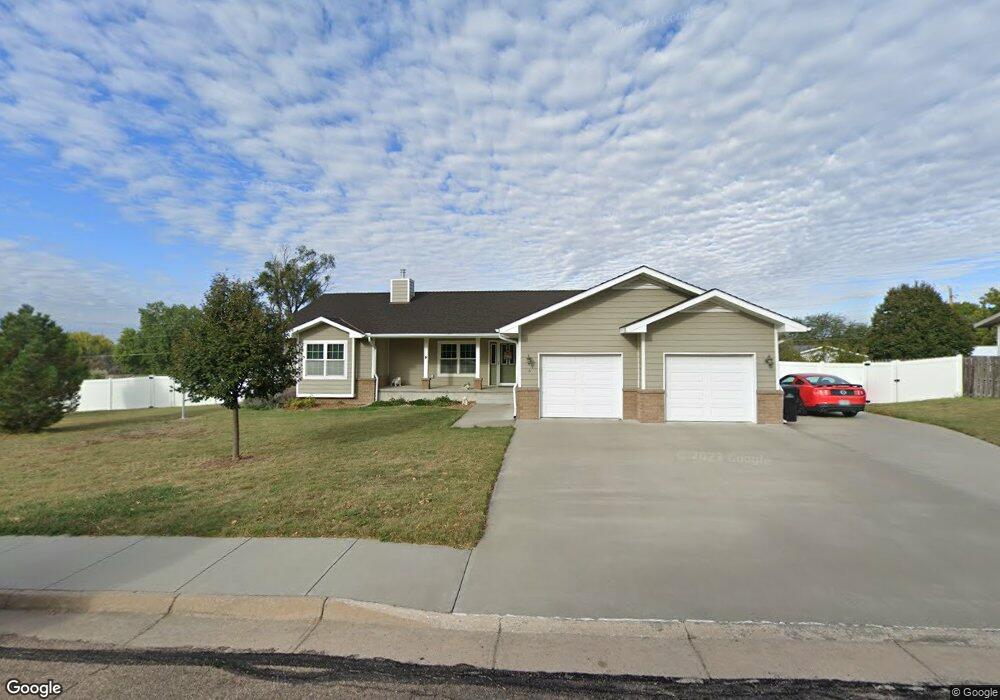
6 Gemini Ct Mc Cook, NE 69001
Estimated Value: $401,000 - $506,000
3
Beds
3
Baths
1,753
Sq Ft
$251/Sq Ft
Est. Value
About This Home
This home is located at 6 Gemini Ct, Mc Cook, NE 69001 and is currently estimated at $439,989, approximately $250 per square foot. 6 Gemini Ct is a home with nearby schools including McCook Elementary School, Central Elementary School, and McCook Junior High School.
Ownership History
Date
Name
Owned For
Owner Type
Purchase Details
Closed on
Dec 12, 2024
Sold by
Scheer Kari A F and Scheer Gabriel J
Bought by
Koetter Benjamin Jayson and Koetter Tera Lynn
Current Estimated Value
Home Financials for this Owner
Home Financials are based on the most recent Mortgage that was taken out on this home.
Original Mortgage
$394,250
Outstanding Balance
$390,387
Interest Rate
6.72%
Mortgage Type
New Conventional
Estimated Equity
$49,602
Purchase Details
Closed on
Jan 27, 2019
Sold by
Fries Travis and Fries Suzanne
Bought by
Scheer Kari A F and Scheer Gabriel J
Home Financials for this Owner
Home Financials are based on the most recent Mortgage that was taken out on this home.
Original Mortgage
$283,500
Interest Rate
3.82%
Mortgage Type
New Conventional
Create a Home Valuation Report for This Property
The Home Valuation Report is an in-depth analysis detailing your home's value as well as a comparison with similar homes in the area
Home Values in the Area
Average Home Value in this Area
Purchase History
| Date | Buyer | Sale Price | Title Company |
|---|---|---|---|
| Koetter Benjamin Jayson | $415,000 | Mc Cook Abstract | |
| Koetter Benjamin Jayson | $415,000 | Mc Cook Abstract | |
| Scheer Kari A F | $305,000 | Nebraska Title Company |
Source: Public Records
Mortgage History
| Date | Status | Borrower | Loan Amount |
|---|---|---|---|
| Open | Koetter Benjamin Jayson | $394,250 | |
| Closed | Koetter Benjamin Jayson | $394,250 | |
| Previous Owner | Scheer Kari A F | $283,500 |
Source: Public Records
Tax History
| Year | Tax Paid | Tax Assessment Tax Assessment Total Assessment is a certain percentage of the fair market value that is determined by local assessors to be the total taxable value of land and additions on the property. | Land | Improvement |
|---|---|---|---|---|
| 2025 | $4,959 | $409,584 | $31,574 | $378,010 |
| 2024 | $4,959 | $378,408 | $31,574 | $346,834 |
| 2023 | $5,882 | $357,274 | $31,574 | $325,700 |
| 2022 | $5,755 | $329,272 | $27,632 | $301,640 |
| 2021 | $5,430 | $297,994 | $27,632 | $270,362 |
| 2020 | $4,363 | $239,624 | $17,133 | $222,491 |
| 2019 | $4,331 | $239,624 | $17,133 | $222,491 |
| 2018 | $4,275 | $239,624 | $17,133 | $222,491 |
| 2017 | $4,144 | $239,624 | $17,133 | $222,491 |
| 2016 | $3,783 | $219,398 | $17,133 | $202,265 |
| 2015 | $3,682 | $219,398 | $17,133 | $202,265 |
| 2014 | $3,712 | $210,730 | $17,133 | $193,597 |
Source: Public Records
Map
Nearby Homes
- 1401 E C St
- 0 Club House Dr
- 107 S 7th St
- 801 E 1st St
- 1109 W 4th St
- 811 W S St
- 813 W S St
- 38875 U S 6
- 71814 Calabria Dr
- 71653 Road 383
- 38169 Road 721
- 37896 U S 6
- 71318 Drive 398
- 0 Tbd Road 314 Unit 11636443
- 0000 County Rd 314
- 71345 Nebraska 25
- 525 Radnor Ave
- 445 Palermo Ave
- 27255 Road Bb
- 820 Mousel Ave
Your Personal Tour Guide
Ask me questions while you tour the home.