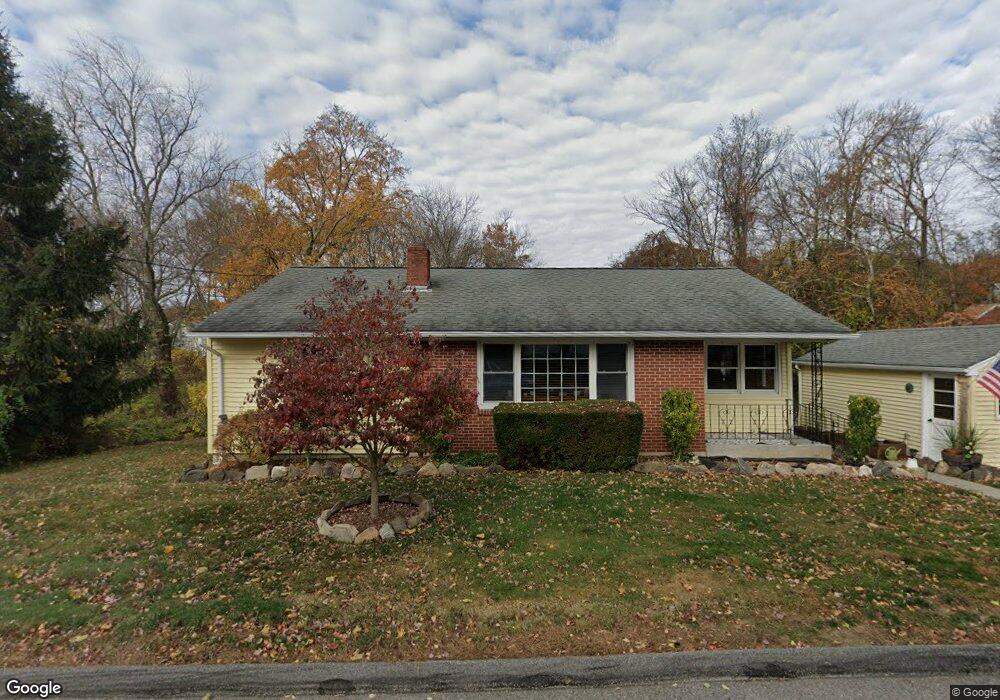
6 Glen Ct Norwich, CT 06360
Central Norwich NeighborhoodEstimated Value: $276,000 - $315,000
3
Beds
1
Bath
1,187
Sq Ft
$243/Sq Ft
Est. Value
About This Home
This home is located at 6 Glen Ct, Norwich, CT 06360 and is currently estimated at $288,976, approximately $243 per square foot. 6 Glen Ct is a home located in New London County with nearby schools including Uncas Elementary School, Teachers' Memorial Global Studies Magnet Middle, and Mayflower Montessori School.
Ownership History
Date
Name
Owned For
Owner Type
Purchase Details
Closed on
Aug 15, 2008
Sold by
Eldredge Charles
Bought by
Allen Elizabeth and Allen William
Current Estimated Value
Home Financials for this Owner
Home Financials are based on the most recent Mortgage that was taken out on this home.
Original Mortgage
$173,700
Outstanding Balance
$114,395
Interest Rate
6.4%
Estimated Equity
$174,581
Create a Home Valuation Report for This Property
The Home Valuation Report is an in-depth analysis detailing your home's value as well as a comparison with similar homes in the area
Home Values in the Area
Average Home Value in this Area
Purchase History
| Date | Buyer | Sale Price | Title Company |
|---|---|---|---|
| Allen Elizabeth | $177,000 | -- | |
| Allen Elizabeth | $177,000 | -- |
Source: Public Records
Mortgage History
| Date | Status | Borrower | Loan Amount |
|---|---|---|---|
| Open | Allen Elizabeth | $11,079 | |
| Open | Allen Elizabeth | $173,700 | |
| Closed | Allen Elizabeth | $173,700 | |
| Previous Owner | Allen Elizabeth | $52,000 |
Source: Public Records
Tax History
| Year | Tax Paid | Tax Assessment Tax Assessment Total Assessment is a certain percentage of the fair market value that is determined by local assessors to be the total taxable value of land and additions on the property. | Land | Improvement |
|---|---|---|---|---|
| 2025 | $6,512 | $160,900 | $41,900 | $119,000 |
| 2024 | $6,146 | $160,900 | $41,900 | $119,000 |
| 2023 | $4,611 | $94,800 | $28,600 | $66,200 |
| 2022 | $4,596 | $94,800 | $28,600 | $66,200 |
| 2021 | $4,611 | $94,800 | $28,600 | $66,200 |
| 2020 | $4,595 | $94,800 | $28,600 | $66,200 |
| 2019 | $4,549 | $94,800 | $28,600 | $66,200 |
| 2018 | $4,181 | $86,400 | $28,600 | $57,800 |
| 2017 | $4,211 | $86,400 | $28,600 | $57,800 |
| 2016 | $4,239 | $86,400 | $28,600 | $57,800 |
| 2015 | $4,152 | $86,400 | $28,600 | $57,800 |
| 2014 | $3,968 | $86,400 | $28,600 | $57,800 |
Source: Public Records
Map
Nearby Homes
Your Personal Tour Guide
Ask me questions while you tour the home.