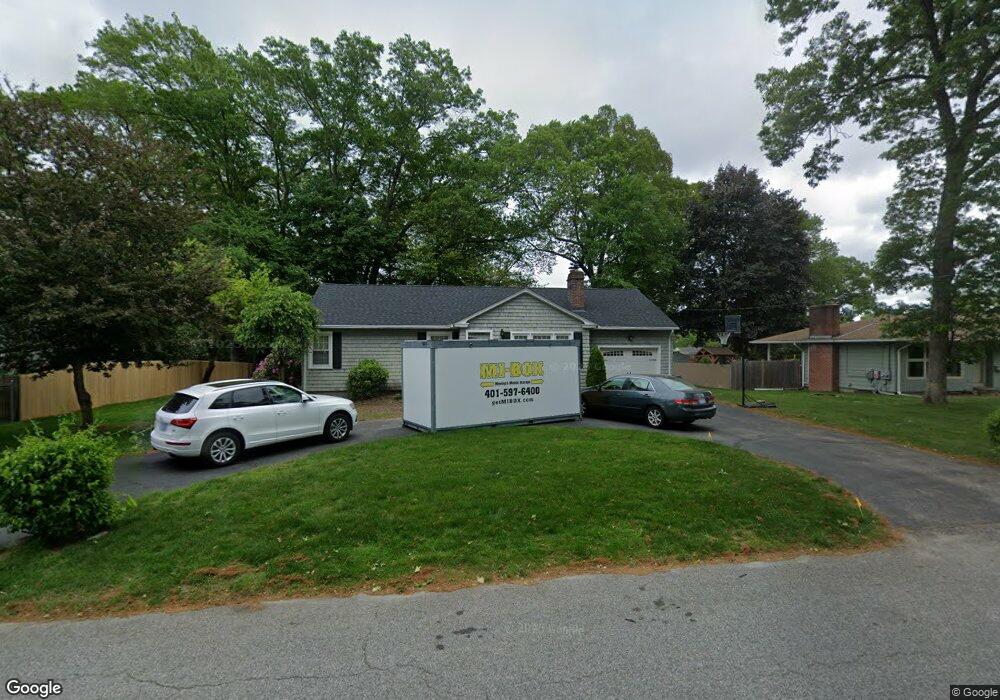
6 Golini Dr Johnston, RI 02919
Greenville Avenue NeighborhoodEstimated Value: $404,000 - $514,000
3
Beds
1
Bath
1,060
Sq Ft
$418/Sq Ft
Est. Value
About This Home
This home is located at 6 Golini Dr, Johnston, RI 02919 and is currently estimated at $442,678, approximately $417 per square foot. 6 Golini Dr is a home located in Providence County with nearby schools including Johnston Senior High School and St. Thomas Regional School.
Ownership History
Date
Name
Owned For
Owner Type
Purchase Details
Closed on
Feb 14, 2023
Sold by
Mrozewicz Joseph P and Mrozewicz Melissa A
Bought by
Mrozewicz Joseph P and Mrozewicz Melissa A
Current Estimated Value
Home Financials for this Owner
Home Financials are based on the most recent Mortgage that was taken out on this home.
Original Mortgage
$244,200
Outstanding Balance
$236,286
Interest Rate
6.15%
Mortgage Type
FHA
Estimated Equity
$206,392
Purchase Details
Closed on
Aug 15, 2008
Sold by
Mrozewicz Christopher C
Bought by
Mrozewicz Joseph P and Moan Melissa A
Home Financials for this Owner
Home Financials are based on the most recent Mortgage that was taken out on this home.
Original Mortgage
$153,357
Interest Rate
6.4%
Mortgage Type
Purchase Money Mortgage
Create a Home Valuation Report for This Property
The Home Valuation Report is an in-depth analysis detailing your home's value as well as a comparison with similar homes in the area
Home Values in the Area
Average Home Value in this Area
Purchase History
| Date | Buyer | Sale Price | Title Company |
|---|---|---|---|
| Mrozewicz Joseph P | -- | None Available | |
| Mrozewicz Joseph P | -- | None Available | |
| Mrozewicz Joseph P | $155,000 | -- | |
| Mrozewicz Joseph P | $155,000 | -- |
Source: Public Records
Mortgage History
| Date | Status | Borrower | Loan Amount |
|---|---|---|---|
| Open | Mrozewicz Joseph P | $244,200 | |
| Closed | Mrozewicz Joseph P | $244,200 | |
| Previous Owner | Mrozewicz Joseph P | $36,636 | |
| Previous Owner | Mrozewicz Joseph P | $159,759 | |
| Previous Owner | Mrozewicz Joseph P | $153,357 |
Source: Public Records
Tax History Compared to Growth
Tax History
| Year | Tax Paid | Tax Assessment Tax Assessment Total Assessment is a certain percentage of the fair market value that is determined by local assessors to be the total taxable value of land and additions on the property. | Land | Improvement |
|---|---|---|---|---|
| 2025 | $4,964 | $317,800 | $96,800 | $221,000 |
| 2024 | $4,862 | $317,800 | $96,800 | $221,000 |
| 2023 | $4,862 | $317,800 | $96,800 | $221,000 |
| 2022 | $3,514 | $189,000 | $74,300 | $114,700 |
| 2021 | $4,392 | $189,000 | $74,300 | $114,700 |
| 2018 | $4,239 | $154,200 | $58,400 | $95,800 |
| 2016 | $5,608 | $154,200 | $58,400 | $95,800 |
| 2015 | $4,502 | $155,300 | $61,000 | $94,300 |
| 2014 | $3,572 | $155,300 | $61,000 | $94,300 |
| 2013 | $4,465 | $155,300 | $61,000 | $94,300 |
Source: Public Records
Map
Nearby Homes
- 7 Belvedere St
- 41 Belvedere St
- 17 David Dr
- 65 Carpenter Dr
- 17 Salina Ave
- 4 Barbato Dr
- 0 Buona Vista Ave Unit 1329320
- 8 Buona Vista Ave
- 742 Greenville Ave
- 657 Greenville Ave
- 18 Carriage Way
- 11 Bowen St
- 136 George Waterman Rd
- 5 Katherine Dr
- 315 George Waterman Rd
- 1 Colony Dr
- 5 Gano Ave
- 20 Kensington Way
- 397 George Waterman Rd
- 8 Kensington Way